After the fact, as Yasi hit Queensland on February 3rd, we may try to analyse what gave our amateur extreme event forecast attempt!Actually, the Australian Bureau of Meteorology was quite accurate and Yasi hit exactly were forecasted apparently. SMOS also was accurate and soils which appeared to be the dryest in this area were so, meaning that runoff was not too extreme and floods were not too bad except in the south (MacKay) where SMOS reported high soil moisture levels ( see previous post)

rainfall on the arrival of Yasi
Bom rainfall map on the arrival of Yasi (Feb 3)
BoM map for the following day (Feb 4)

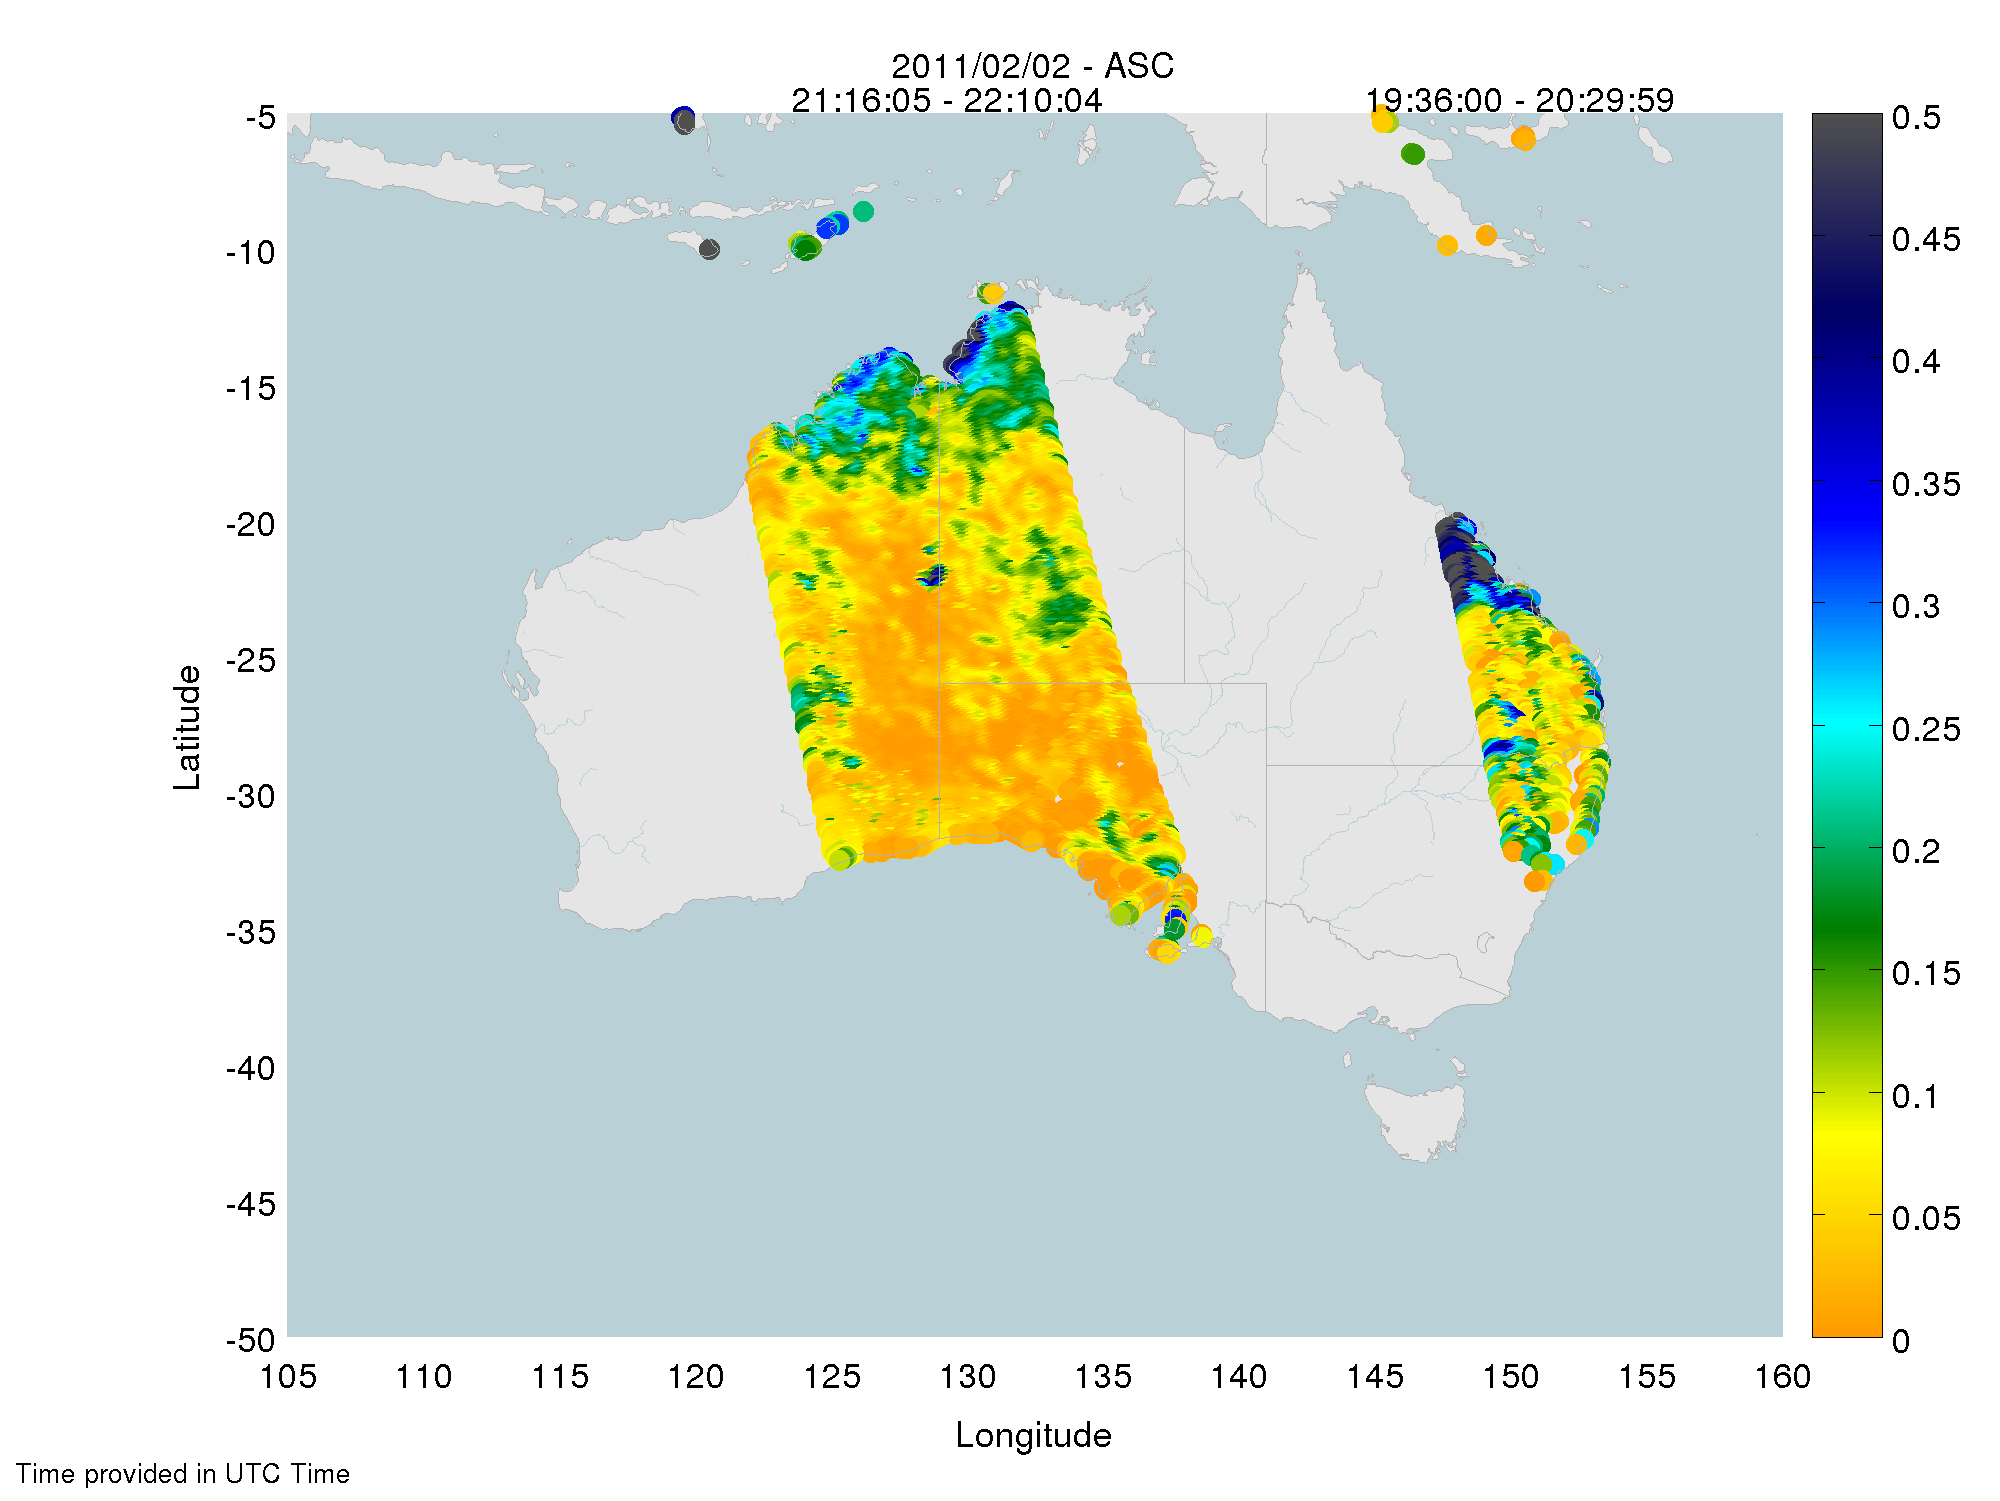
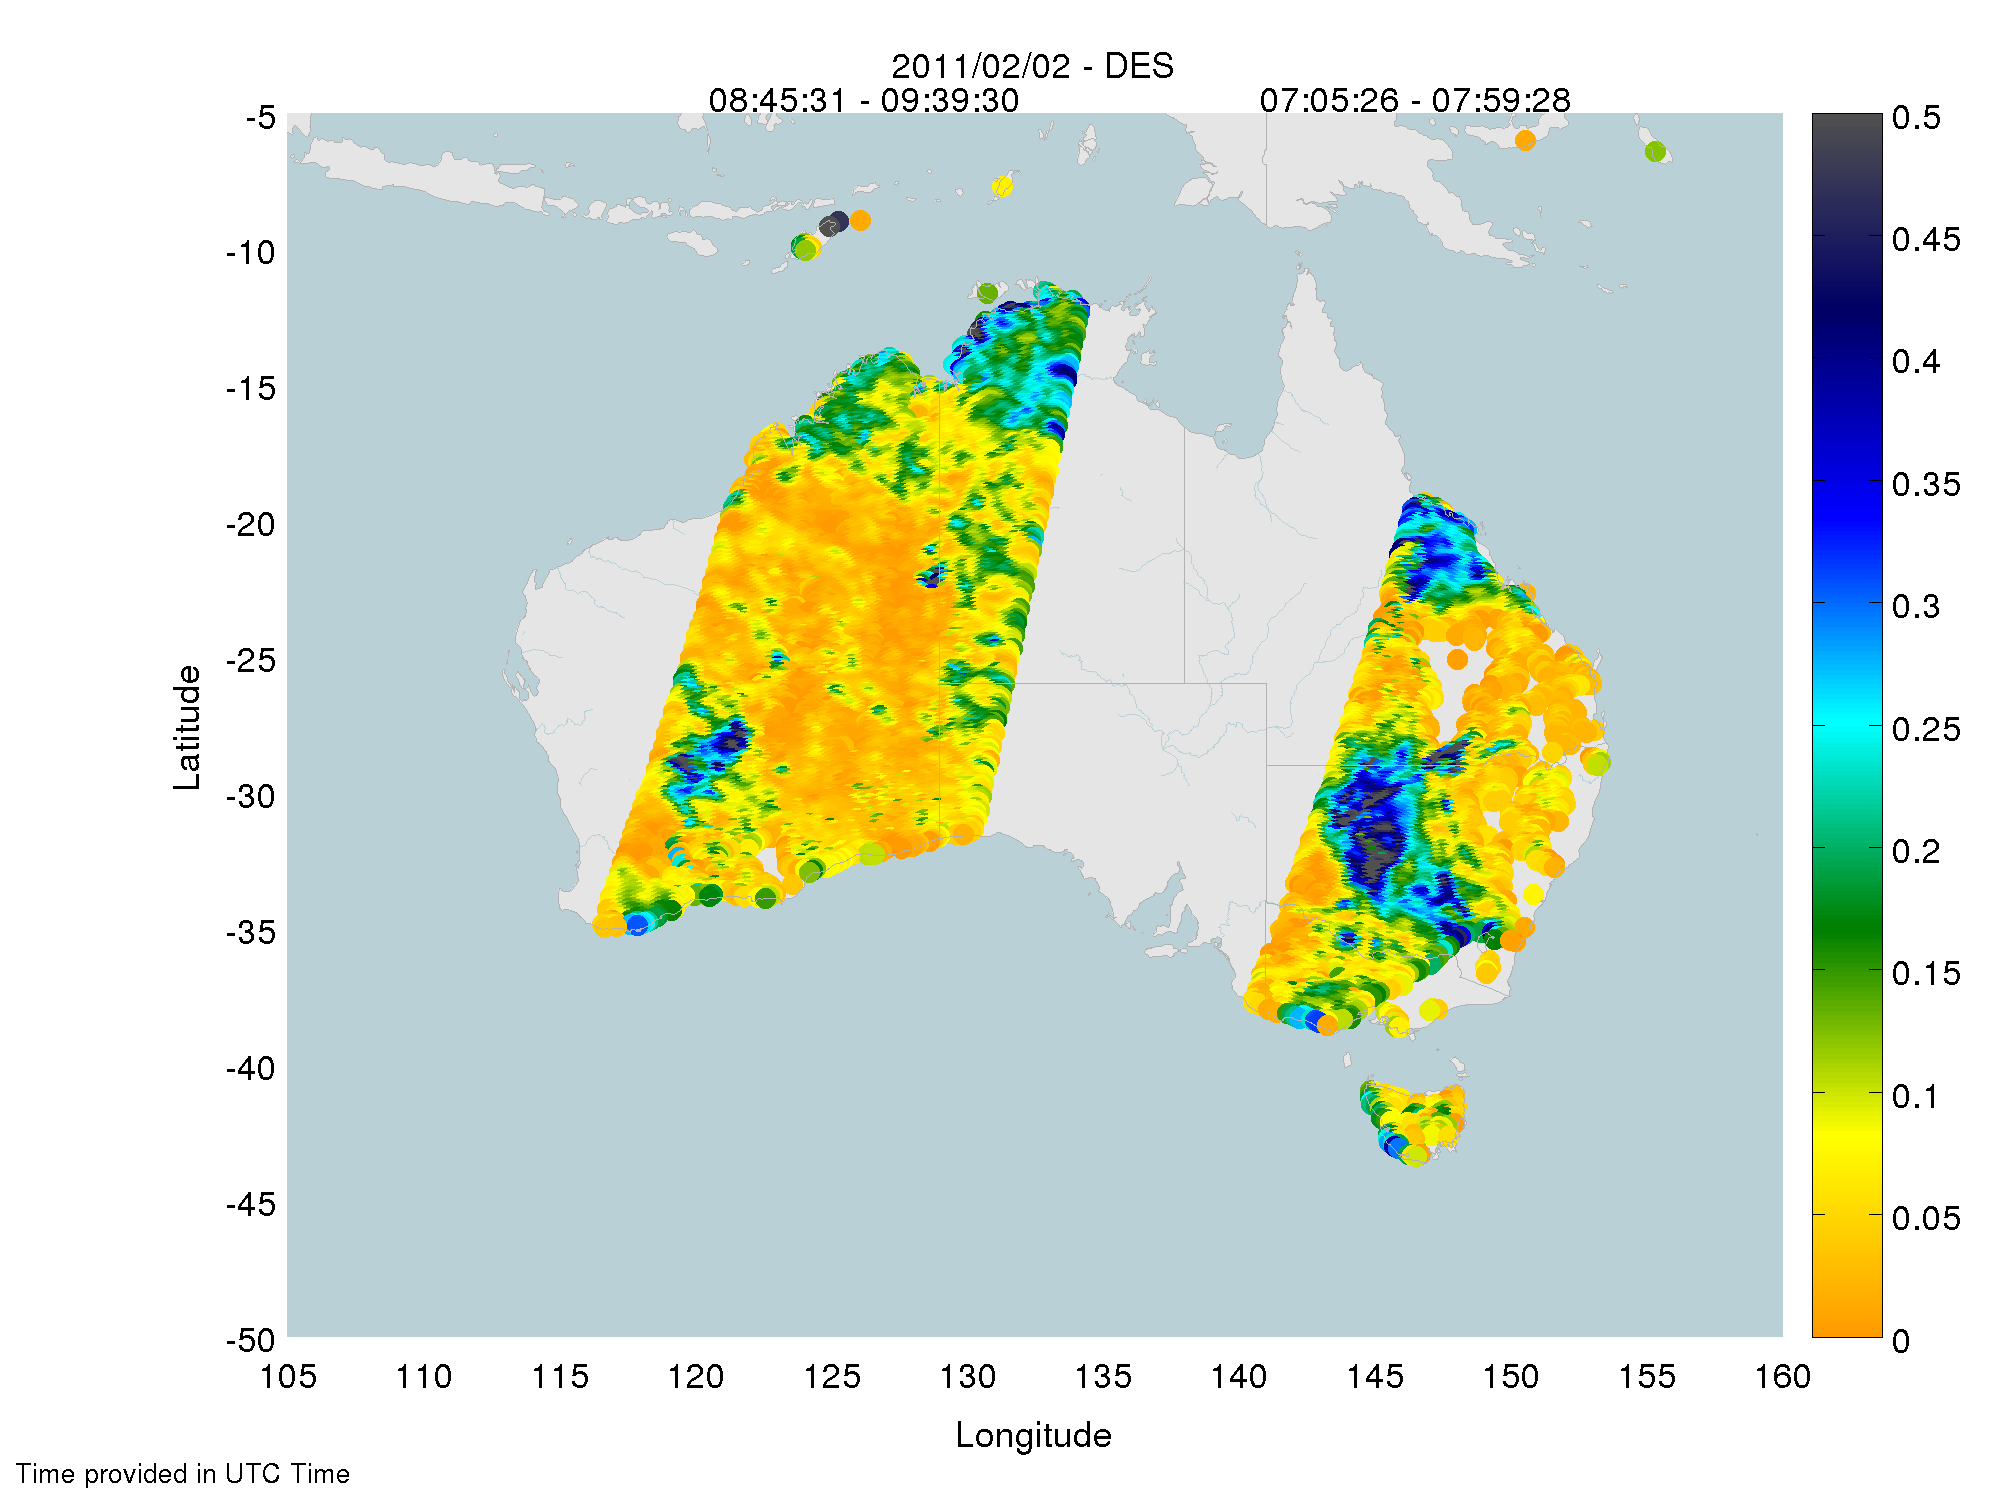
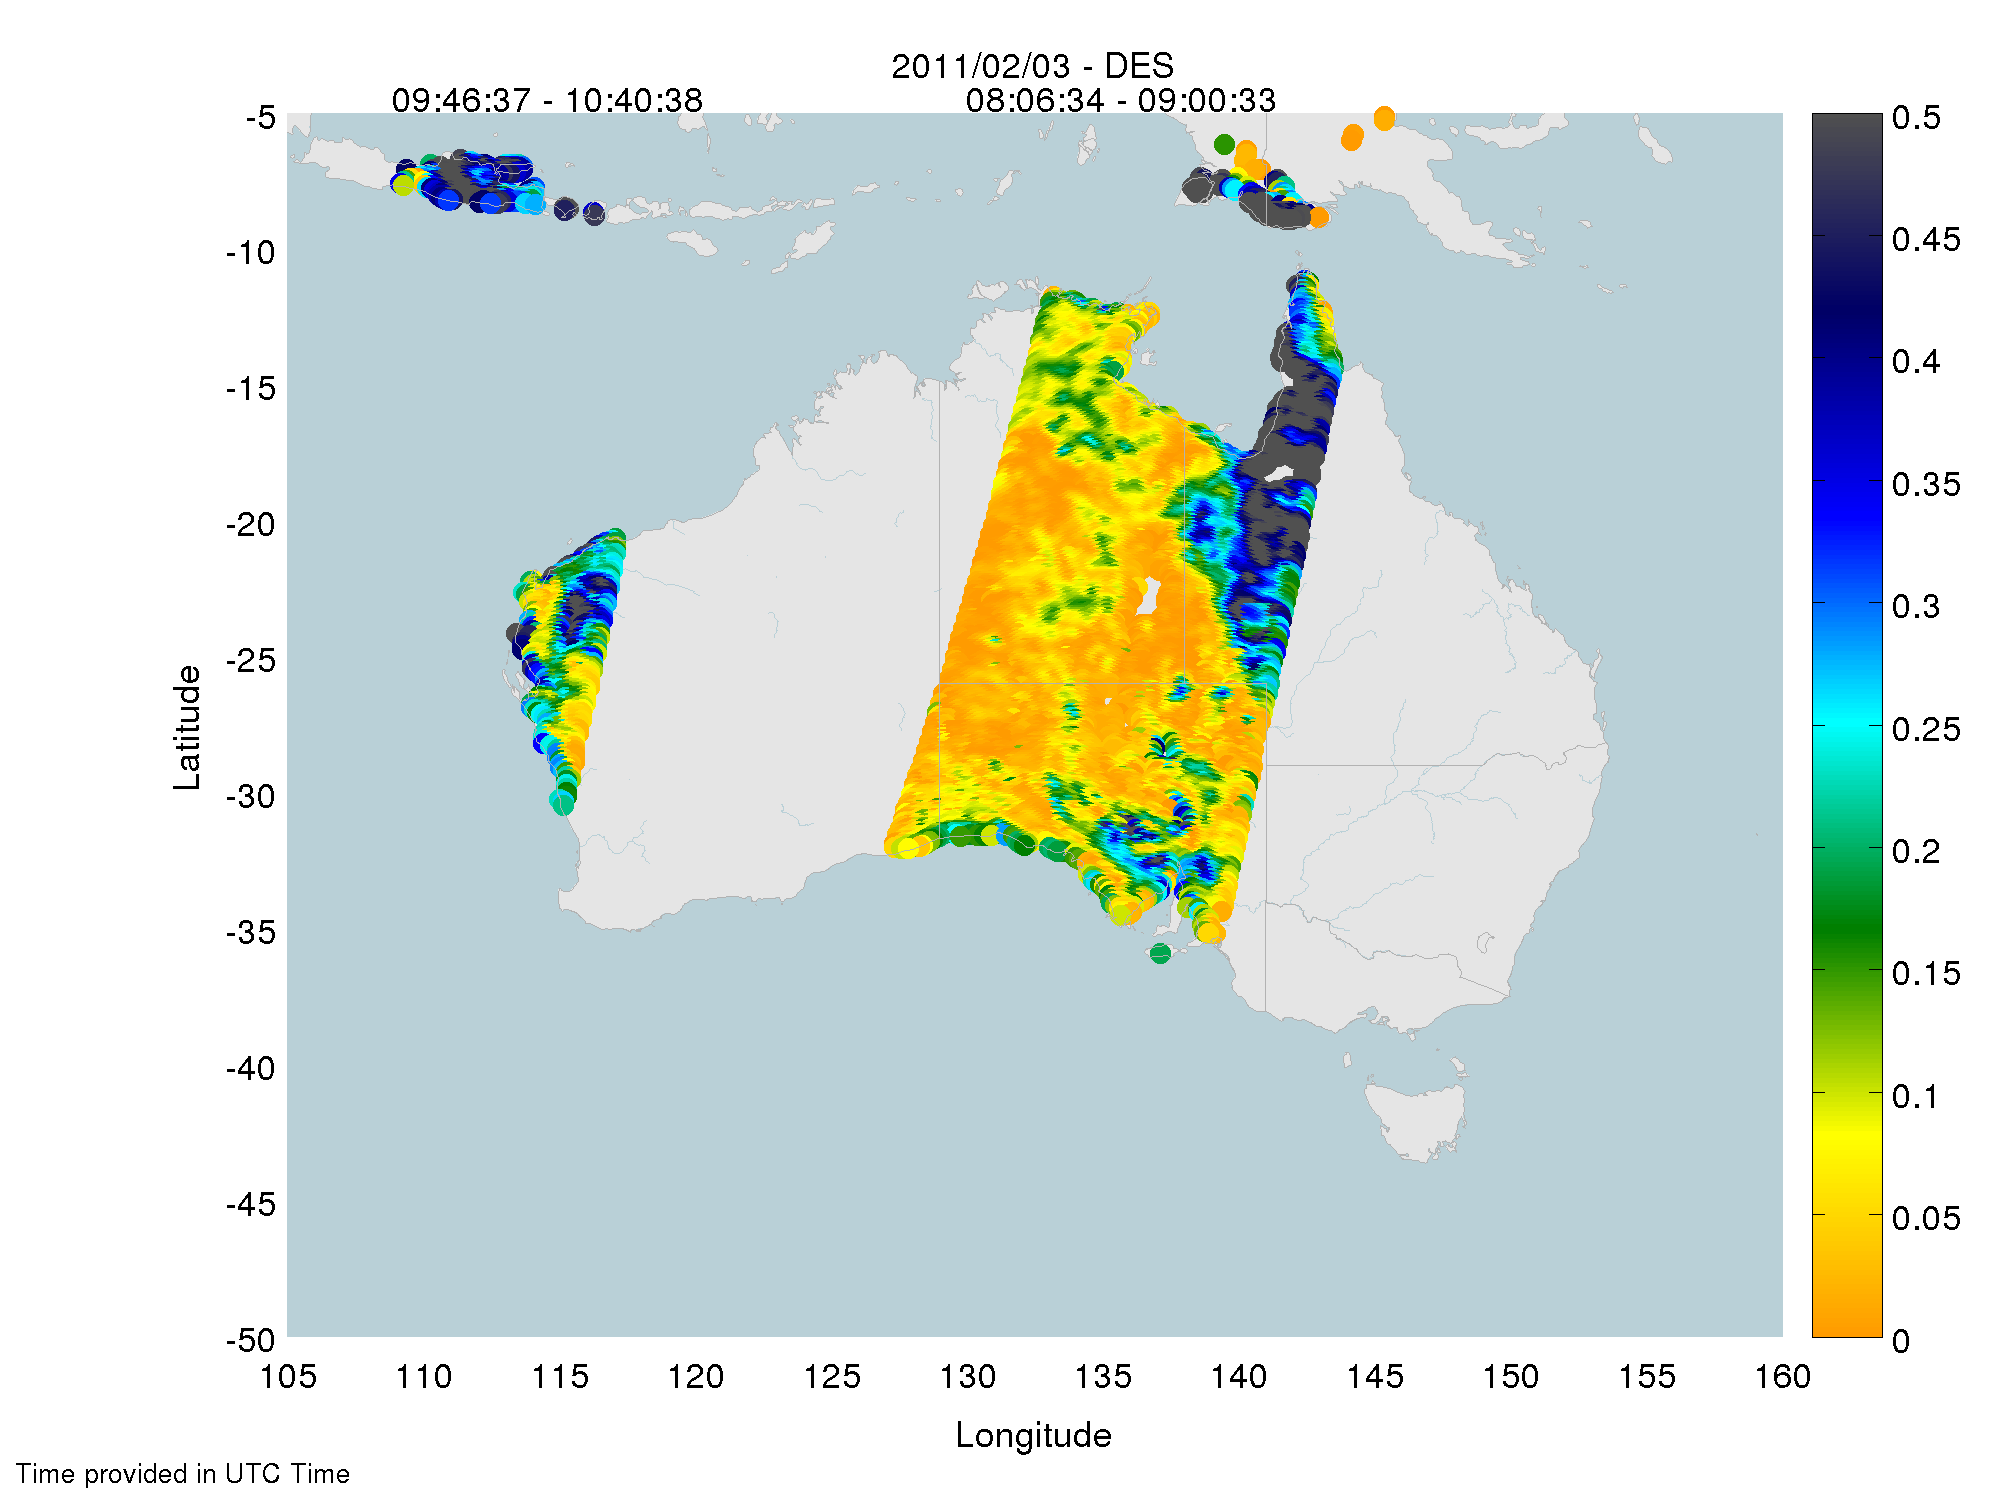
And the smos maps are as follows

SMOS 2/2/2011 morning
SMOS 2/2/2011 after noon
03/Feb 2011 pm
03/Feb 2011 pm
So it seems that SMOS did provide some information which proved to be correct. I am sure our colleagues at BoM will make more extensive analysis of this, as they have all the data and skills, but, from our little corner, it appears that SMOS could be used to forecast, for a given rainfall forecast, flood risks….to be continued…
animated SMOS soil moisture maps for Yasi
Claire and Yann (and BoM)

Leave a Reply

Your email address will not be published. Required fields are marked *

This site uses Akismet to reduce spam. Learn how your comment data is processed.