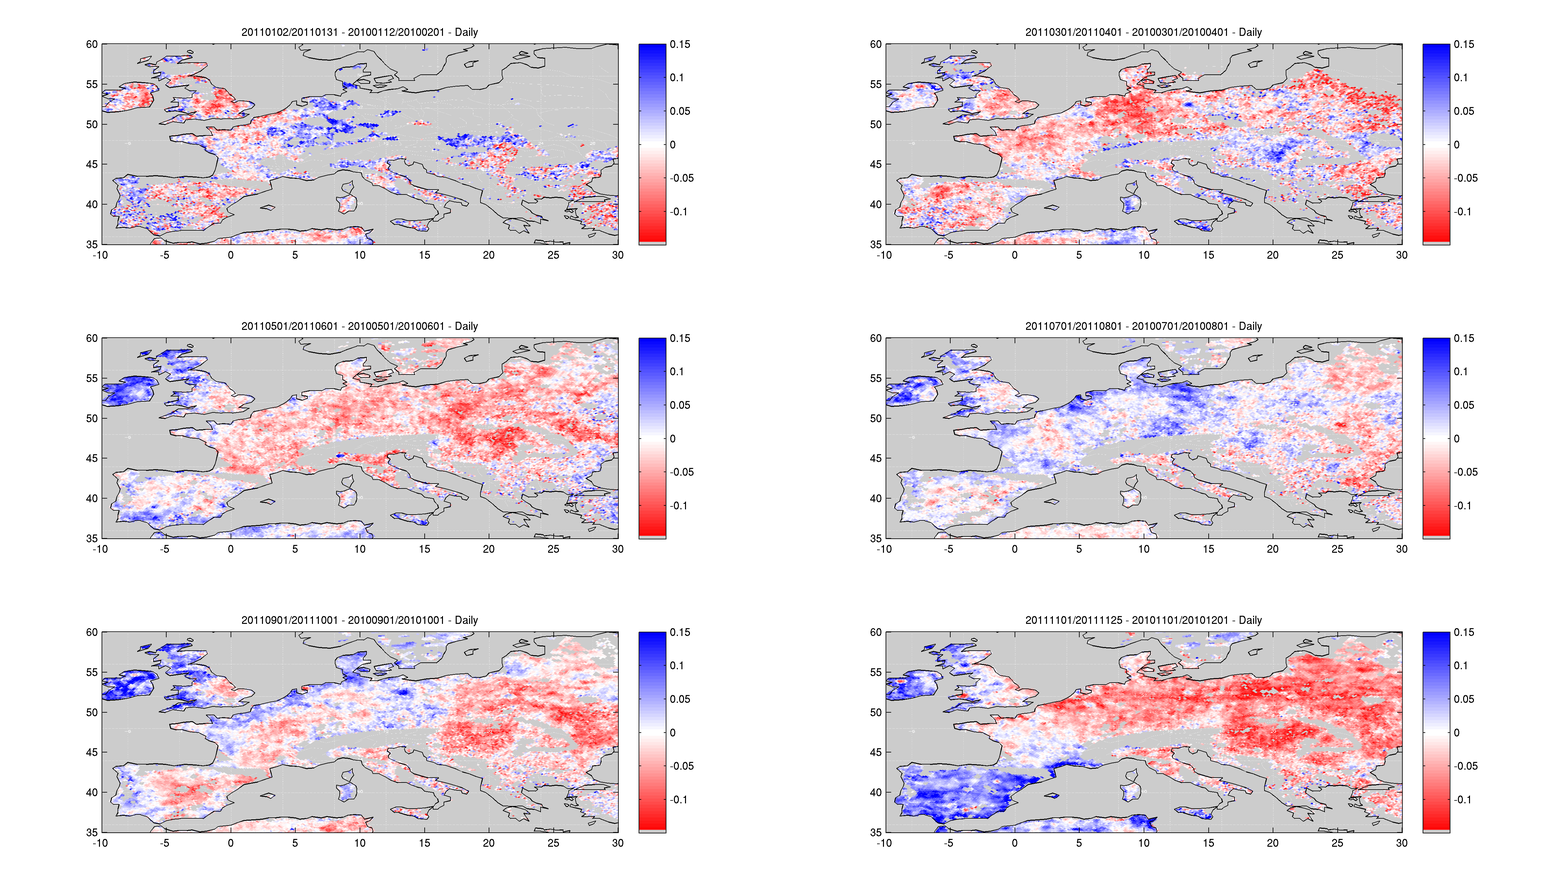
Using SMOS soil moisture monthly data François Cabot produced the following animation.It is made by simply comparing monthly soil moisture in 2010 and 2011…We can clearly see the drought starting in Western Europe (UK, France,…) in March-April to slowly but surely move twowards teh East (Germany, Poland, …) as we get to November while Spain and Southern France get some rain…Just click on the image to see the animation

