SMOS delivers one “strange” or rather unusual product which is an estimate of the surface dielectric constant (see ATBD!). A example of it’s potential use is shown below with the fields of dielectric constant estimated over Europe for two periods corresponding to the arrival of a cold front over Western Europe. The first picture corresponds to the period going from January 28 to 31 2012. The cold spell is arriving but not quite there yet. The second picture shows the dielectric constant for the period going from February 2nd to 5th, 2012. As one might remember, it was quiet cold and soil was often frozen while snow was widely spread over Europe (and quite dry as it was cold). The dielectric constant consequently dropped significantly. This can been seen on the pictures with the dielectric constant dropping from values equivalent to wet soils (typically 15) to values for very dry or frozen soils (1 to 3) which gives this more blueish shade.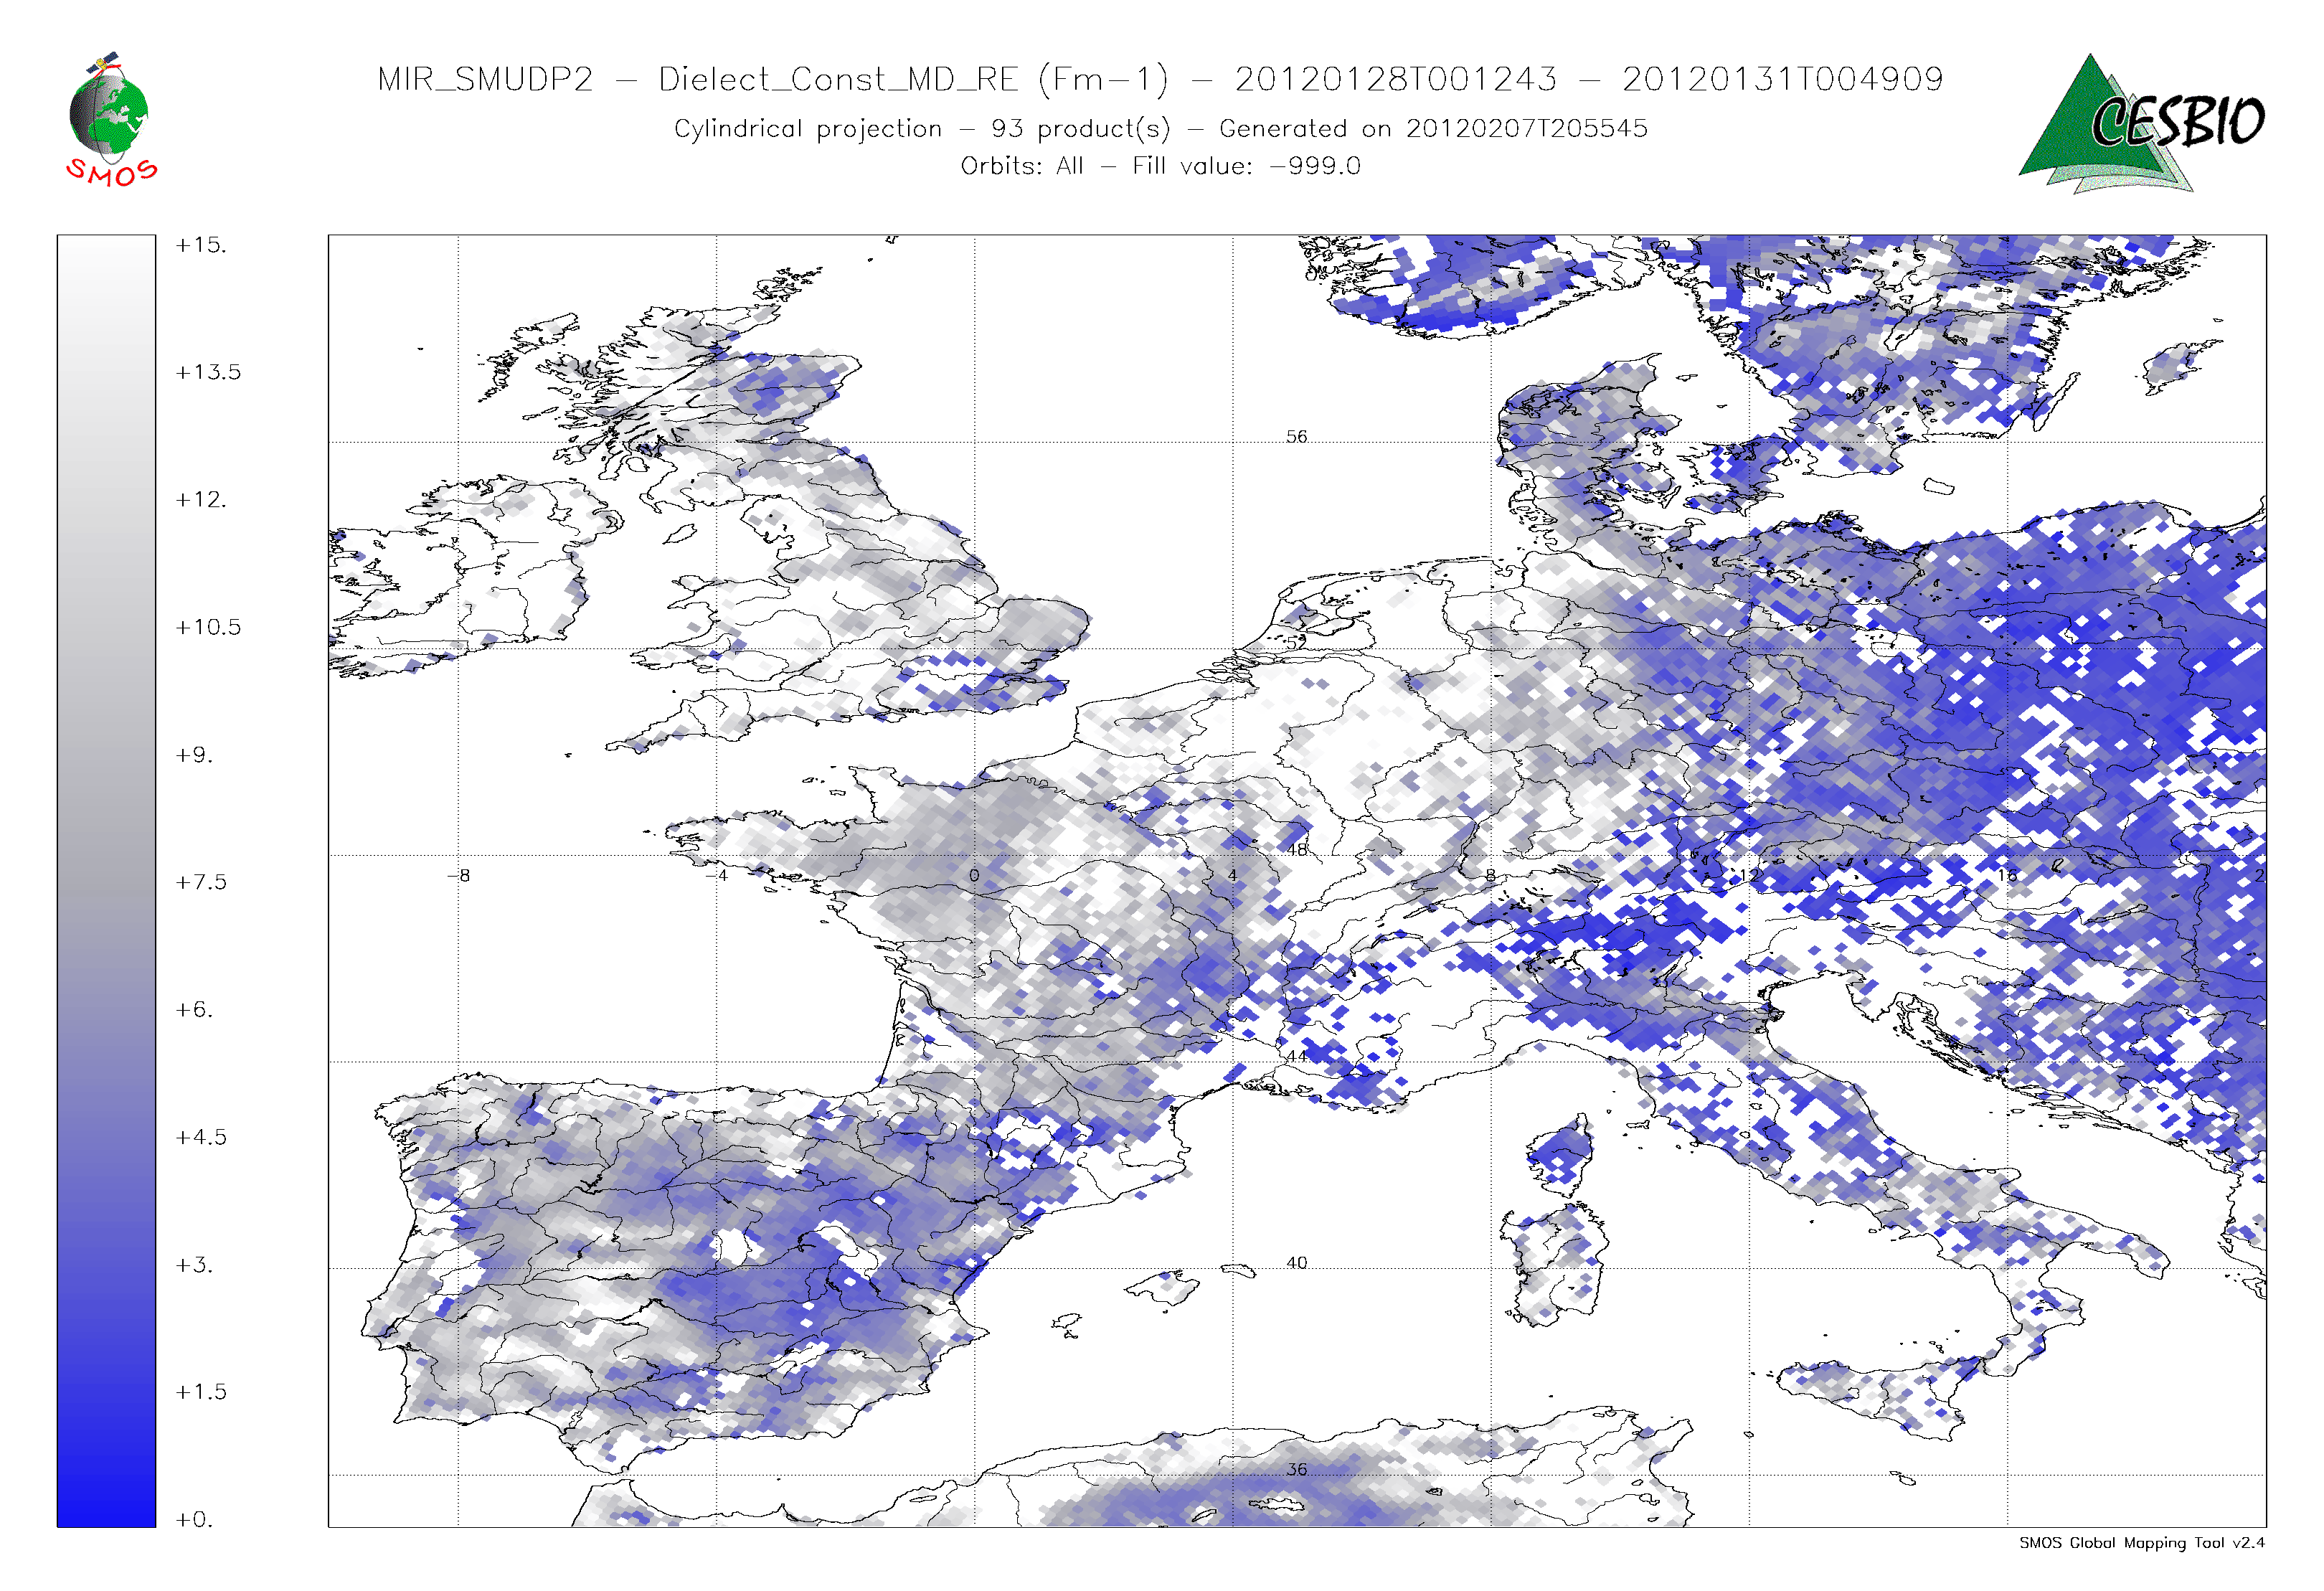 January 28 to 31: western Europe is grayish white hence high dielectric constant values …
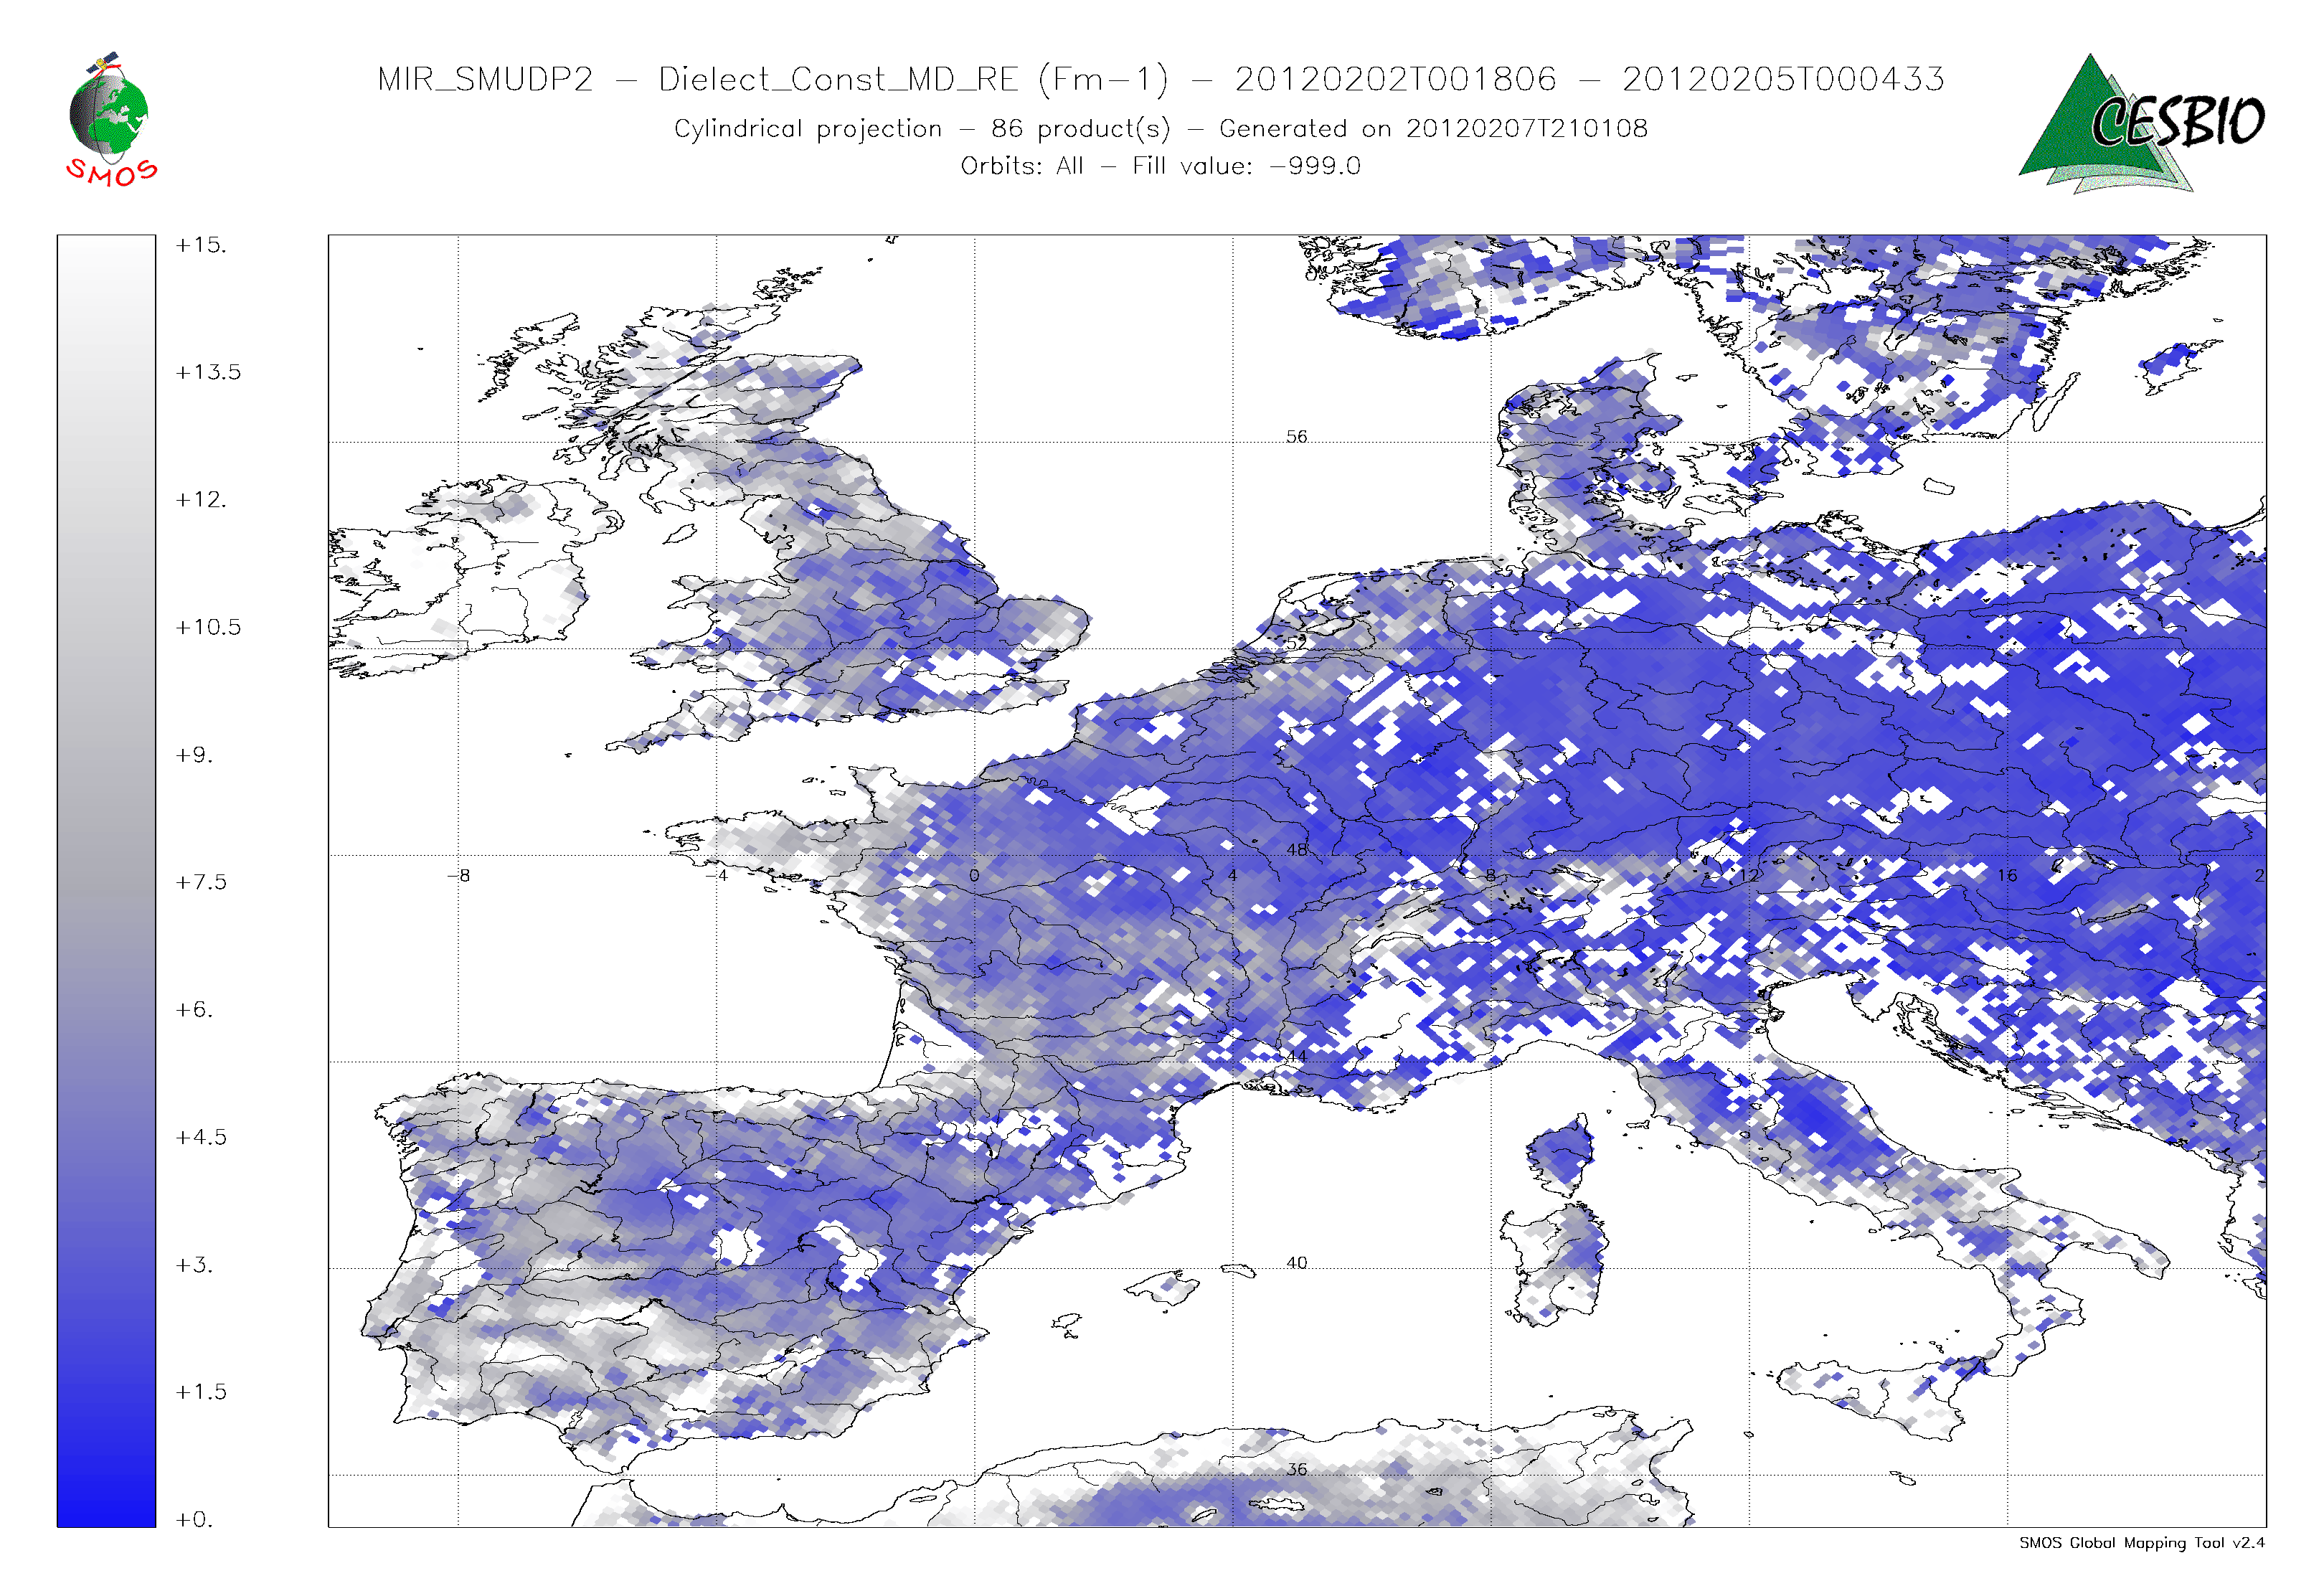 February 2-5, 2012. Western Europe is under snow or frozen, … much lower values of the dielectric constant.Al Bitar and al, CESBIO