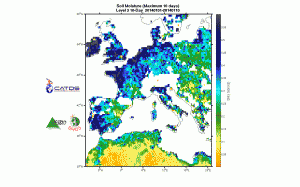
Last winter was rather warm and very wet in western Europe while in the US and Canada it was cold or rather very cold!We looked at the SMOS data collected over Europe as obtained from CATDS and Arnaud extracted the wettest value over ten day periods (here ascending orbits) as shown on the animation below ( to see the animation click on it)
 Fig1: maximum soil moisture (around 6 am) over successive ten day periods from January 1 to February 10 2014 as measured by SMOS.
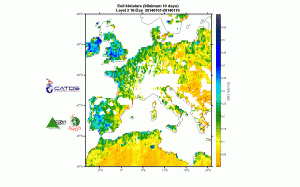
One can see that in Ireland, SW England , W France and SW France soil moisture saturates (value at or above field capacity) indicating sodden soils with heaving pounding. If we look at the product proving minimum value fro the descending orbits we see that even at the driest if was not always completely dry.
 Fig2: minimum soil moisture (around 6 pm) over successive ten day periods from January 1 to February 10 2014 as measured by SMOS.
Even in the driest state, note that in some areas the soils are still quite wet.
These picture show how we can track saturated to flooded areas with SMOS. Also note the impact of RFI in some areas , giving rather dry soils when / where not expected.
