During the AACES campaign in Australia several rain events occurred as Arnaud and Chris mentioned in earlier blogs. Everyone was happy about it (may be not the guys on the field working in the mud) and eager to see SMOS data.
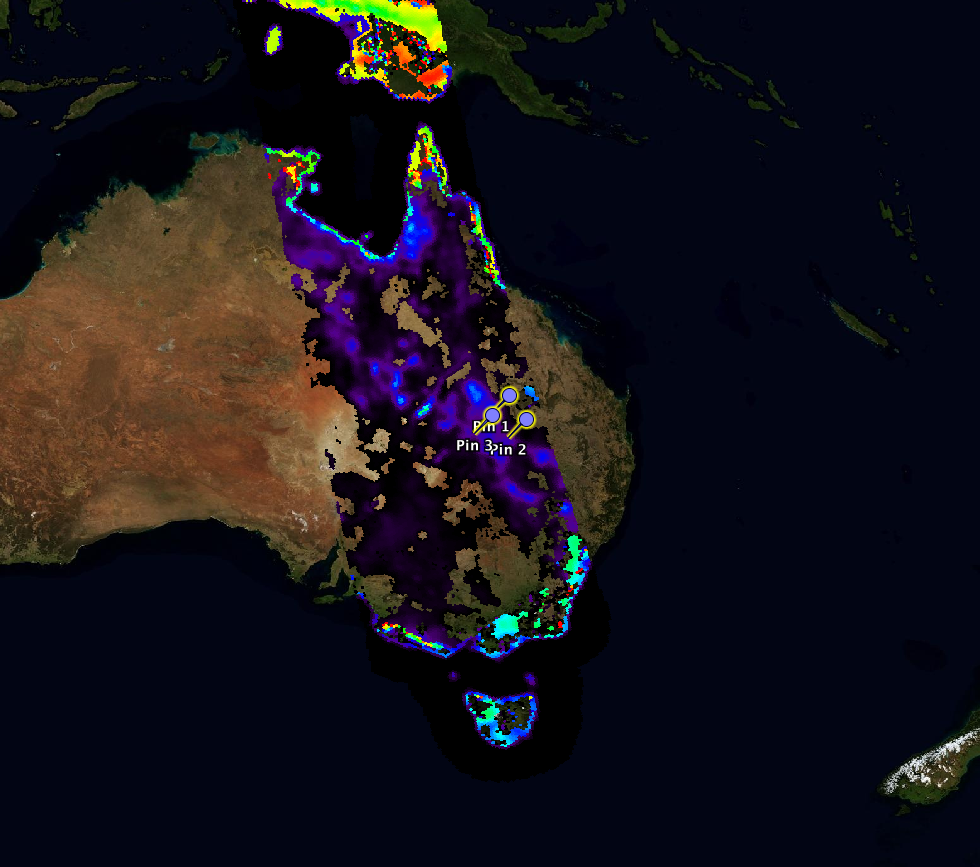
Well, figure 1-a shows the soil moisture over four controls points near Charleville Queensland (see figure 2). The control points shown here are not exactly inside the campaign area, but rain occurred at these locations at least this is what ECMWF forecast predicts (figure 1-c) and what was observed by a nearby weather station in Charleville Queensland (figure 1-b).
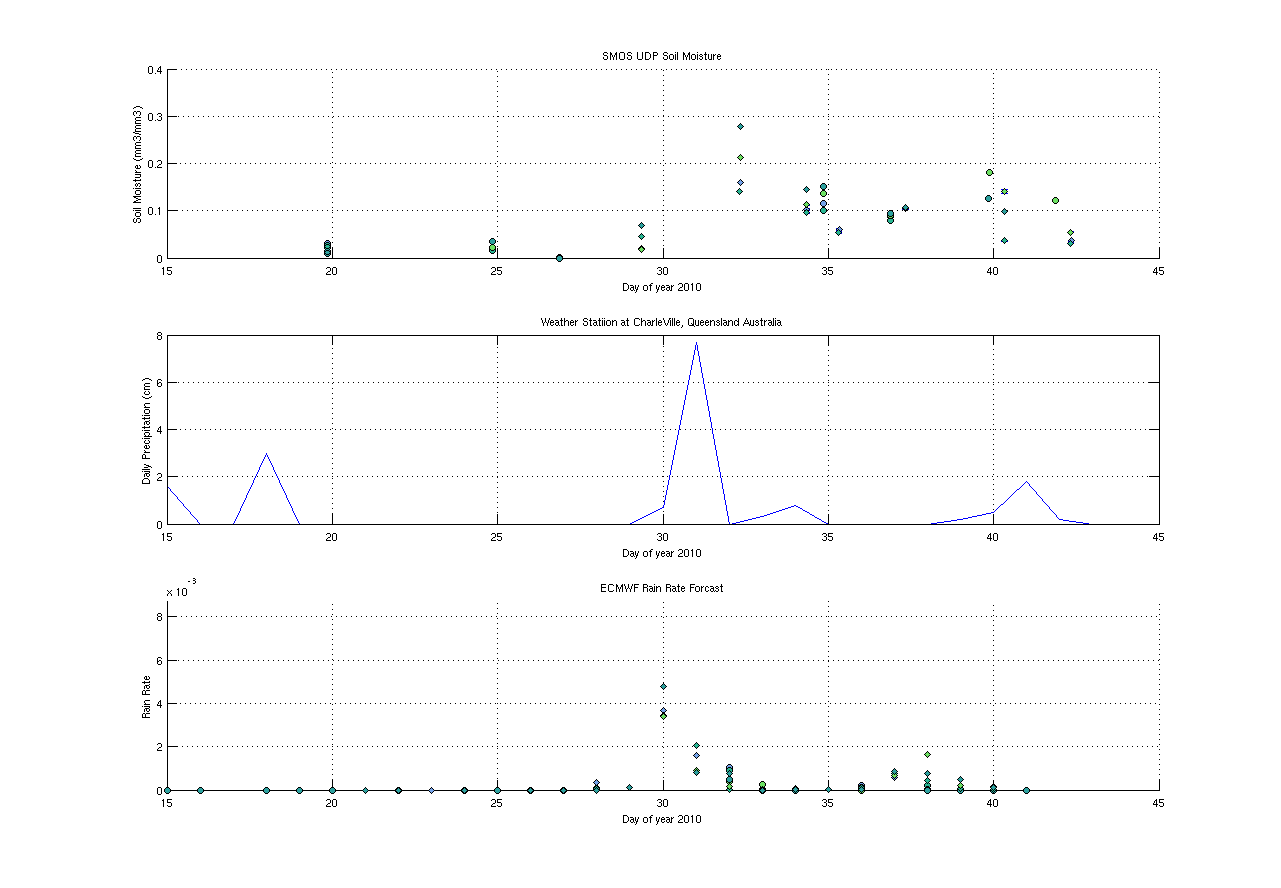
In the plot above, Ascending ( circle symbol) and descending (diamond symbol) orbits are considered from 14/01/2010 till 12/02/2010. Only pixels where the inversion was successful are plotted. The points have nominal surfaces with nearly no vegetation (so no optical thickness is inversed). The Soil moisture increases after the rain event and it follow an exponential decay as expected. The event of 30 January 2010 is well depicted.
From the curves it is clear that SMOS Level 2 processor can already deliver valuable data over nominal surfaces. The Level 1 data used here are not optimal. Several corrections has been omitted and the L1 processor version is not the final. So we can expect even better data in the nearby futur.
I wan’t be long in this blog, many comments can be made but we will leave it for later.
Cheers
Ahmad