From J Boutin, and colleagues from LOCEAN
Salinity observing satellites have the potential to monitor river fresh-water plumes mesoscale spatio-temporal variations better than any other observing system. In the case of the SMOS mission, this capacity was hampered due to the contamination of SMOS data processing by strong land-sea emissivity contrasts.
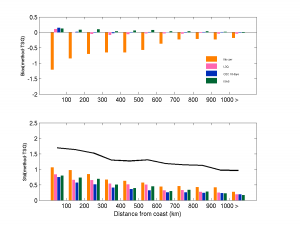
With the new systematic error mitigation, SMOS SSS becomes more consistent with the independent SMAP SSS close to land, for instance capturing consistent spatio-temporal variations of low salinity waters in the Bay of Bengal and Gulf of Mexico (see Figure 1 below). The standard deviation of the differences between SMOS and SMAP weekly SSS is less than 0.3 pss in most of the open ocean. The standard deviation of the differences between 18-day SMOS SSS and 100-km averaged ship SSS is 0.20 pss (0.24 pss before correction) in the open ocean (see Figure 2 below). Even if this standard deviation of the differences increases closer to land, the larger SSS variability yields a more favorable signal-to-noise ratio, with r2 between SMOS and SMAP SSS larger than 0.8. The correction also reduces systematic biases associated with man-made Radio Frequency Interferences (RFI), although SMOS remains more impacted by RFI than SMAP. This newly-processed dataset will allow the analysis of SSS variability over a larger than 8 years period in regions previously heavily influenced by land-sea contamination, such as the Bay of Bengal or the Gulf of Mexico.
The new SMOS SSS products are available at CATDS (‘CEC LOCEAN debias v2’ produced by LOCEAN/ACRI expertise center and ‘CPDC L3Q’ produced by the near real time CATDS chain). The paper is available here (the link is freely active during 2 months).
Figure 1: SMOS SSS corrected according to (a,d) Kolodziejczyk et al. (2016) methodology, (b, e) the method described in this paper (CEC); (c, f) SMAP SSS, in two areas : (a, b, c) : Bay of Bengal – August 21st 2015; (d, e, f) : Gulf of Mexico – August18th 2015.SMOS and SMAP SSS is averaged over a SMOS repetitive orbit sub-cycle (18 days) and two SMAP repetitive orbit cycles (16 days) respectively. Striking fresh SSS features in better agreement with SMOS (new version) and SMAP are indicated with white arrows.
Figure 2: Statistics of ship comparisons (May 2010-August 2016) binned as a function of the distance from the nearest coast: top) mean difference; bottom) standard deviation of the differences; the black line indicates the standard deviation of ship SSS in each class. Ship and SMOS SSS are integrated over 100 km. Orange: monthly SMOS L3P SSS (without error mitigation) ; pink : monthly SMOS L3Q (with error mitigation; near real time processing); light blue : 18-day SMOS CEC (with error mitigation; LOCEAN/ACRI expertise center processing); green : ISAS (Argo optimal interpolation).


