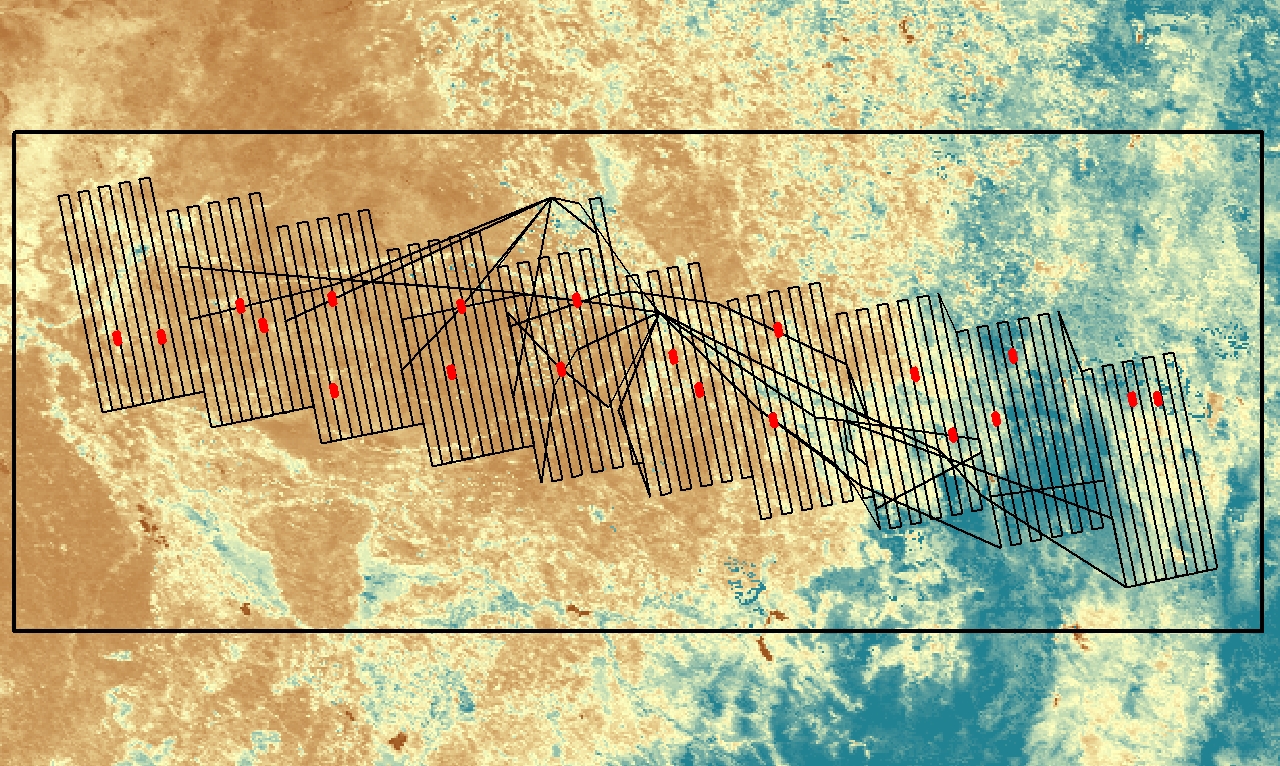
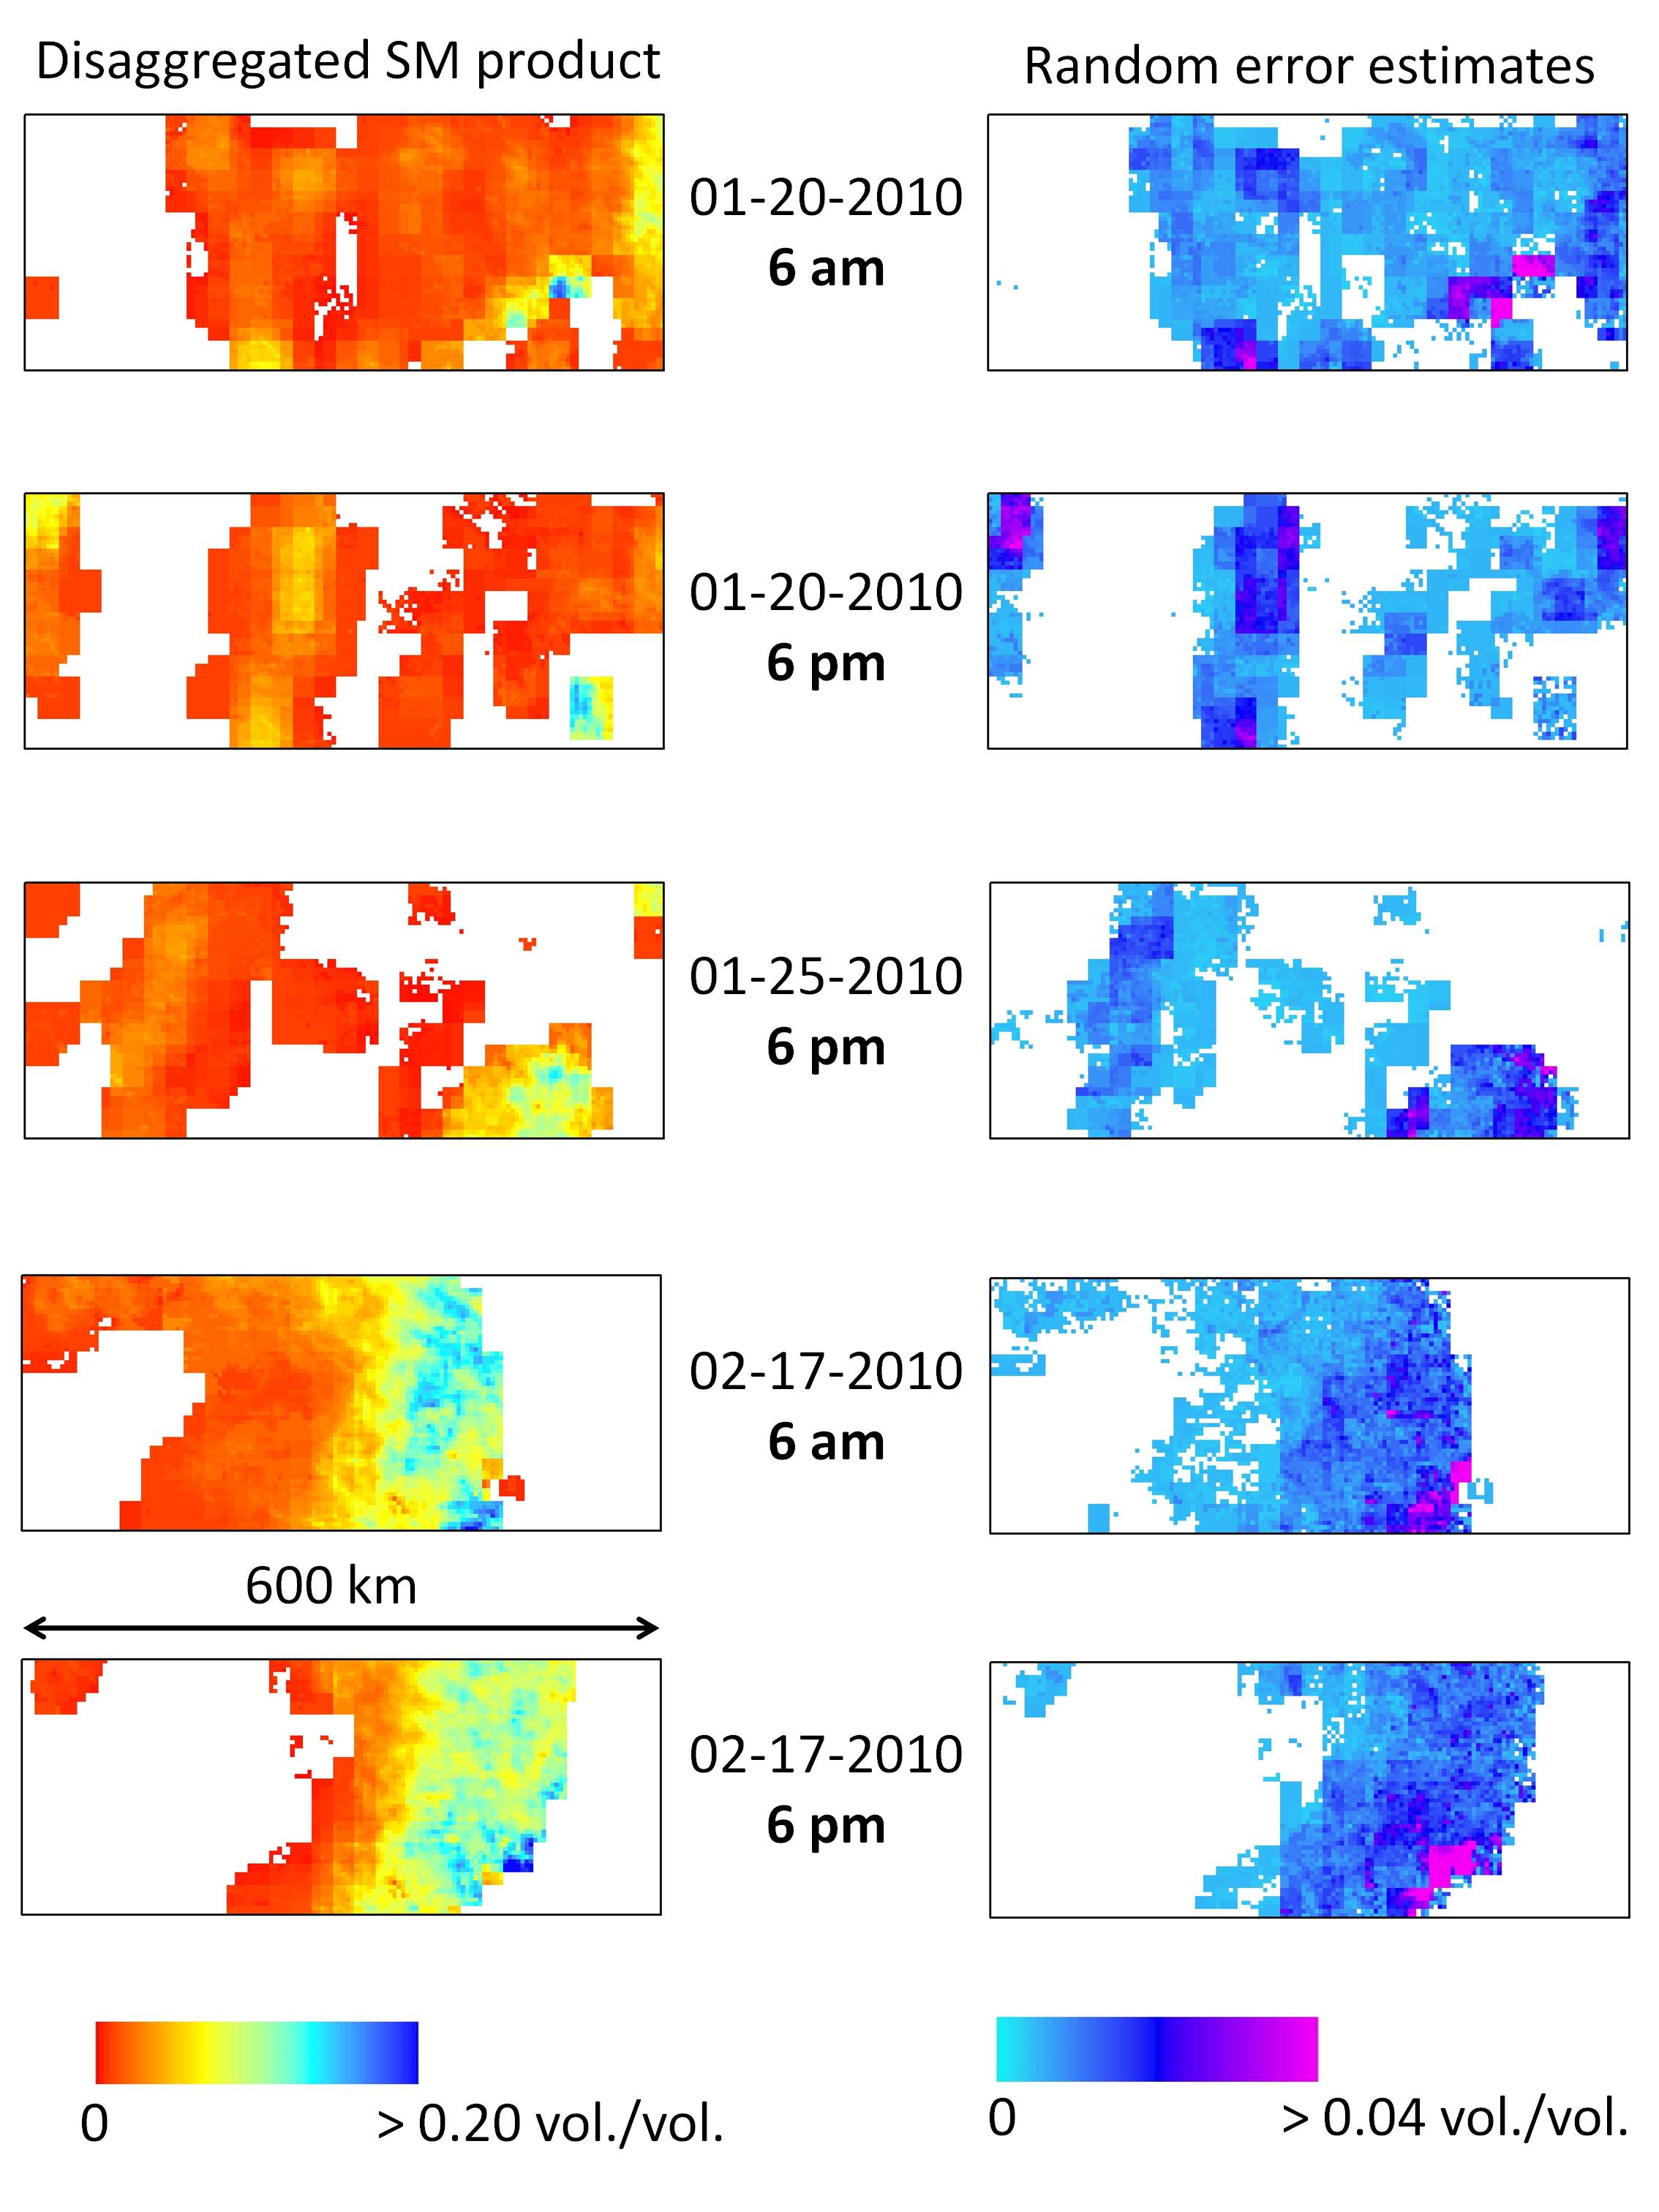
Validating SMOS data is complicated by the large observation scale of spaceborne L-band radiometers. To circumvent the direct comparison between 40 km resolution SMOS data and point-scale in situ measurements one may either upscale ground measurements with aggregation rules, or downscale (disaggregate) remote sensing data at the representativeness scale of ground measurements. Here, we are investigating a combination of both bottom-up and top-down approaches to make ground truth and remote sensing observations match at an intermediate spatial scale.A disaggregation methodology based on 1 km resolution MODIS (MODerate resolution Imaging Spectroradiometer) data is implemented over the Murrumbidgee catchment during the AACES’10 campaign. The SMOS L2 SM product extracted from UDP files is disaggregated at 4 km resolution on a projected grid (UTM 55S). Only the disaggregation part is presented. As a follow-up, the disaggregated SM product could be compared against the average of the ground measurements made within 4 km pixels.

Overview of the AACES’10 flight lines and ground sampling areas. The study area is 600 km (W-E) by 240 km (S-N).
Images of the disaggregated SM product on three dates are presented below. They correspond to days with one or two SMOS overpasses (at 6 am or 6 pm) and two clear sky MODIS overpasses (10 am/Terra and 1 pm/Aqua). Note that the L2 product is provided on a grid (DGG) whose resolution (about 15 km) is finer than the resolution of SMOS radiometer (about 40 km). In fact, SMOS oversamples the observation scene by a factor (40/15)x(40/15)=7. This allows running the disaggregation algorithm at each point of the DGG and applying additional constraints on the disaggregated SM in the overlapping edges of adjacent 40 km pixels. Moreover, random errors in the disaggregated SM product can be estimated as the standard deviation of the different disaggregated SM values obtained using MODIS data collected at both 10 am and 1 pm and using the oversampling of SMOS data.

L2 SM product is disaggregated at 4 km resolution over the AACES'10 study area.
Gaps in the disaggregated SM product are partly due to cloud cover (availability of MODIS data), but mainly to gaps in the L2 SM product. Currently, many SM values retrieved by SML2PP are negative, and negative values are systematically set to -999 (inversion failed) in the UDP files provided by the DPGS. Note that the commisioning phase only takes care of brightness temperatures, not retrieved parameters.In the images above, a “boxy artifact” is still apparent at the low (DGG) resolution. This artifact could be explained both by the parameterization of the disaggregation algorithm, which is done at low resolution from SMOS and aggregated MODIS data, and by errors in L2 product. Analyzing the time series of the disaggregated product and more specifically the persistency of disaggregation parameters may help quantify both effects and hence evaluate SMOS data at the intermediate resolution of 4 km.

Leave a Reply

Your email address will not be published. Required fields are marked *

This site uses Akismet to reduce spam. Learn how your comment data is processed.