SMOS is currently undergoing Cal Val Activities and in this framework at CESBIO we are busy-with colleagues everywhere to compare SMOS data with ground data.In particular, with colleagues in the US we have looked at the SCAN data and several very interesting results are emerging. Below a comparison done by Ahmad AlBitar at CESBIO – CATDS between SMOS and SCAN network data.
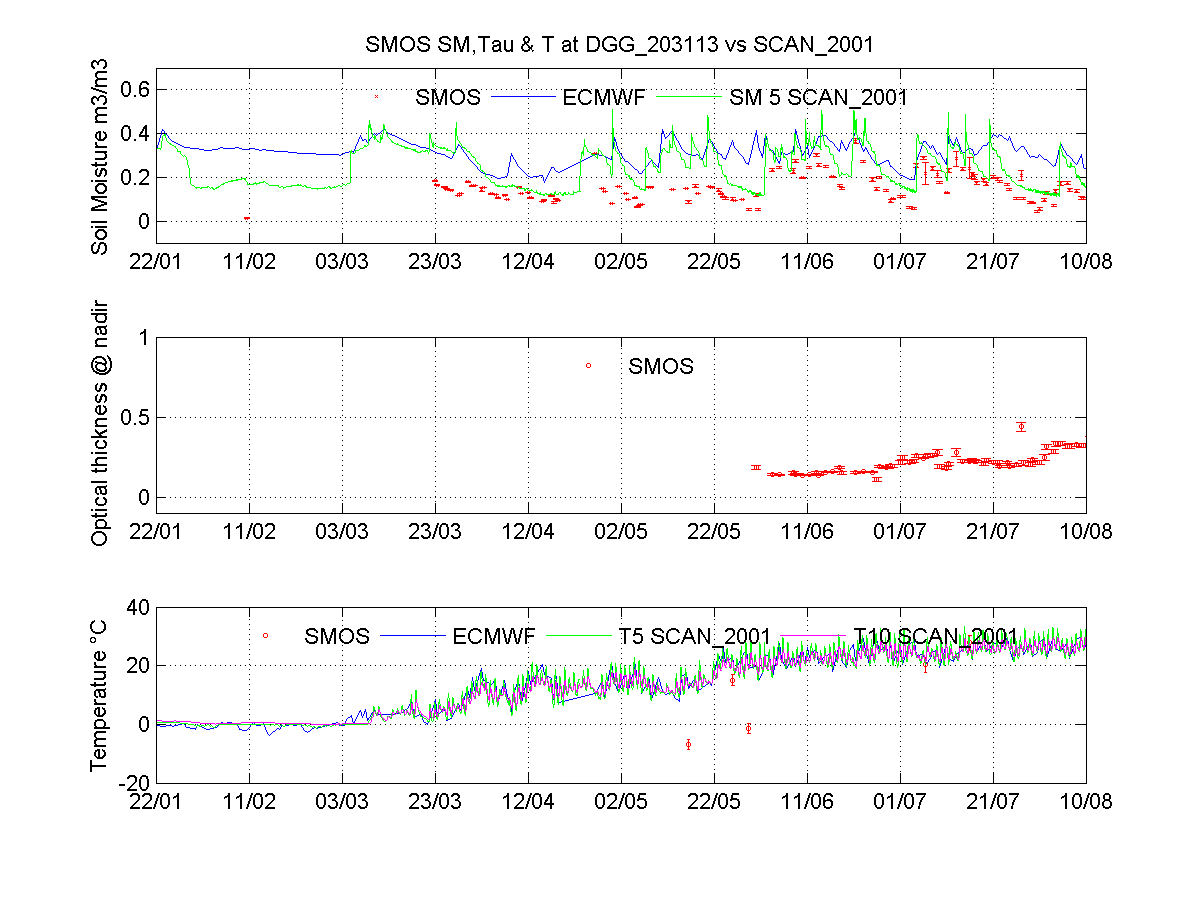
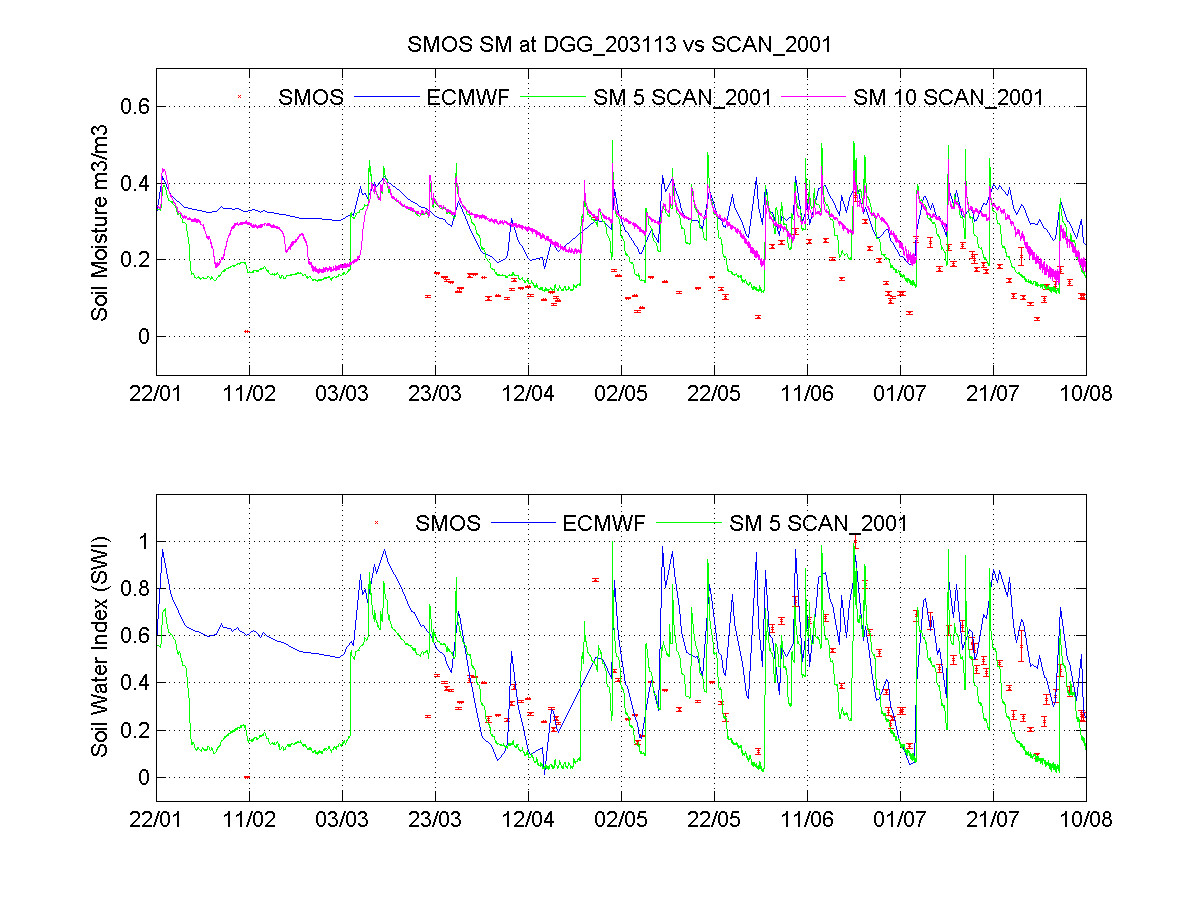
This figure shows a comparison between 3 sources of measurements. In the top panel Ahmad has plotted the absolute soil moisture from ECMWF (blue) Scan (site 2001 in green) and SMOS (red). SMOS still underestimates the others but we can see that the temporal behaviour is very well captured. This is very promising for some applications for SMOS.The middle panel shows the retrieved vegetation opacity. It starts in May only as it was then that the proper algorithm was implemented at ESAC.Note also, in the lower panel where the temperatures plotted the evolution from the first days to today. This clearly emphasizes the improvements carried out on the calibration etc (mainly at level 1 thus). Of course the temperature retrieval is not very often carried out (see ATBD) so only a few points are present but all those for July august are completely embedded in the ECMWF and SCAN curves.Just to show the SMOS ability to capture dry downs, Ahmad has stretched the scales of the three data sets beween 0 and 1 (the so called wetness index!) as shown below. With this trick, we see how well SMOS captures the events.
Very encouraging results indeed, particularly periods where SCAN and SMOS both agree and depart from ECMWF.