Centre d’Etudes Spatiales de la Biosphère
English version
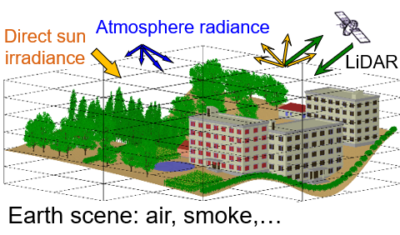
La vocation du Cesbio est de développer des connaissances sur le fonctionnement de la biosphère continentale en faisant un usage important de la télédétection spatiale. Ces connaissances lui permettent de proposer de nouvelles missions spatiales d’observation de la Terre.
Les travaux du Cesbio ont un degré poussé d’interdisciplinarité :
- Recherches en sciences physiques et sciences de la vie
- Articulation entre le spatial et l’étude de notre environnement
- Lien entre la recherche, l’ingénierie (modèles, instrumentation) et le transfert de technologie
Le Cesbio est une Unité Mixte de Recherche (UMR 5126) dont les tutelles sont :
Le Cesbio est aussi une unité sous contrat de l’Institut national de recherche pour l’agriculture, l’alimentation et l’environnement.
Enfin, le Cesbio fait partie de l’Observatoire Midi Pyrénées.
Dernières actualités
3 days DART tutorial on June 4-6, 2024
Please find the announcement of the next DART tutorial organized by CNRS on June 4-6, 2024, close to CESBIO. Teaching is free, including meals and coffee breaks. Everyone is invited, especially permanent CNRS staff, post-docs and trainees. Application Form
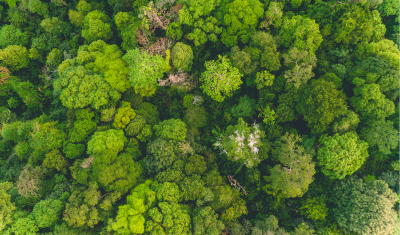
Looking for PhD candidate > DART-EB: 3D modelling of times series of satellite observations and energy balance of vegetation canopies
Supervisors: Jean-Louis Roujean (DR, CNRS), Yingjie Wang (McF, UT3) we are looking for a candidate to apply for the SDUEE doctoral school competition. Duration: 3 yearsStarting date: 01/10/2024Laboratory: CESBIO, Toulouse, FranceDeadline: 30 May 2024 Objective: The objective of the thesis is to develop a comprehensive, accurate, and efficient energy balance model to simulate time series (daily […]
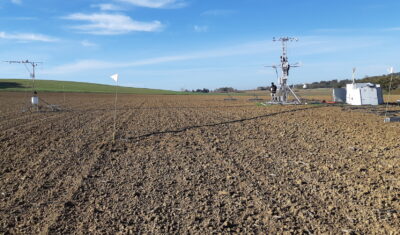
Un instrument à bas coût pour mesurer la respiration du sol
Les chambres portatives pour mesurer la respiration du sol peuvent être des dispositifs « bon marché » mais rester assez précis. La chambre décrite dans cet article est peu coûteuse et construite à partir de pièces disponibles dans le grand commerce, ce qui la rend très accessible. Cette chambre est robuste, simple à utiliser, et […]
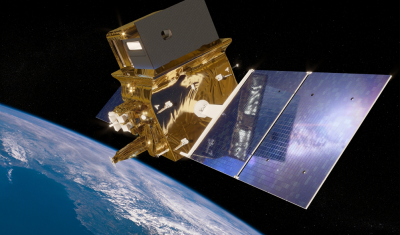
Trishna : scientifiques et ingénieurs font le point
Les 18 et 19 janvier 2024, le groupe mission Trishna, composé de scientifiques de laboratoires de recherche français et européens, d’ingénieurs du CNES et de l’agence spatiale indienne, s’est réuni en hybride au CESBIO pour faire le point sur la mission. La réunion a rassemblé une soixantaine de personnes mobilisées sur les différentes facettes du […]
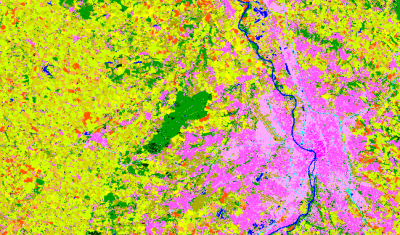
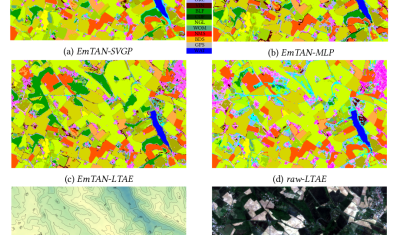
Comment contourner le besoin de grands volumes de données de référence dans les modèles d’apprentissage automatique ?
La mise en œuvre de chaînes de cartographie automatique (occupation des sols, variables bio-physiques) reposant sur des méthodes d’apprentissage nécessite de grandes quantités de données de référence (vérités terrain, annotations par photo-interprétation) et des modèles de machine learning avec beaucoup de paramètres et donc gourmands en ressources de calcul. Une façon de contourner ces difficultés […]
Félicitation pour la soutenance de thèse de Valentine Bellet, Jeudi 29 Février 2024: « L’intelligence artificielle pour la surveillance des écosystèmes à partir de séries temporelles d’images satellites »
[English below] Bonjour à tou.te.s, J’ai le plaisir de vous inviter à ma soutenance de thèse qui aura lieu le jeudi 29 février à 9h30 dans la salle de conférence du CESBIO à Toulouse. Le sujet de thèse est le suivant: « L’intelligence artificielle pour la surveillance des écosystèmes à partir de series temporelles d’images satellites ». […]