The organizers of the 2017 International Glaciology Society meeting in Boulder tweeted this animation of the Vavilov Glacier (October Revolution Island, Russian Arctic):
IGS #Boulder17 Michael Willis: In recent years, the Vavilov Arctic ice cap has catastrophically collapsed. https://t.co/dgEeDqchFX pic.twitter.com/l0ChXWdTyE
— CIRES (@CIRESnews) August 16, 2017
I tweeted a similar animation using only Sentinel-2 imagery for the years 2016 and 2017:


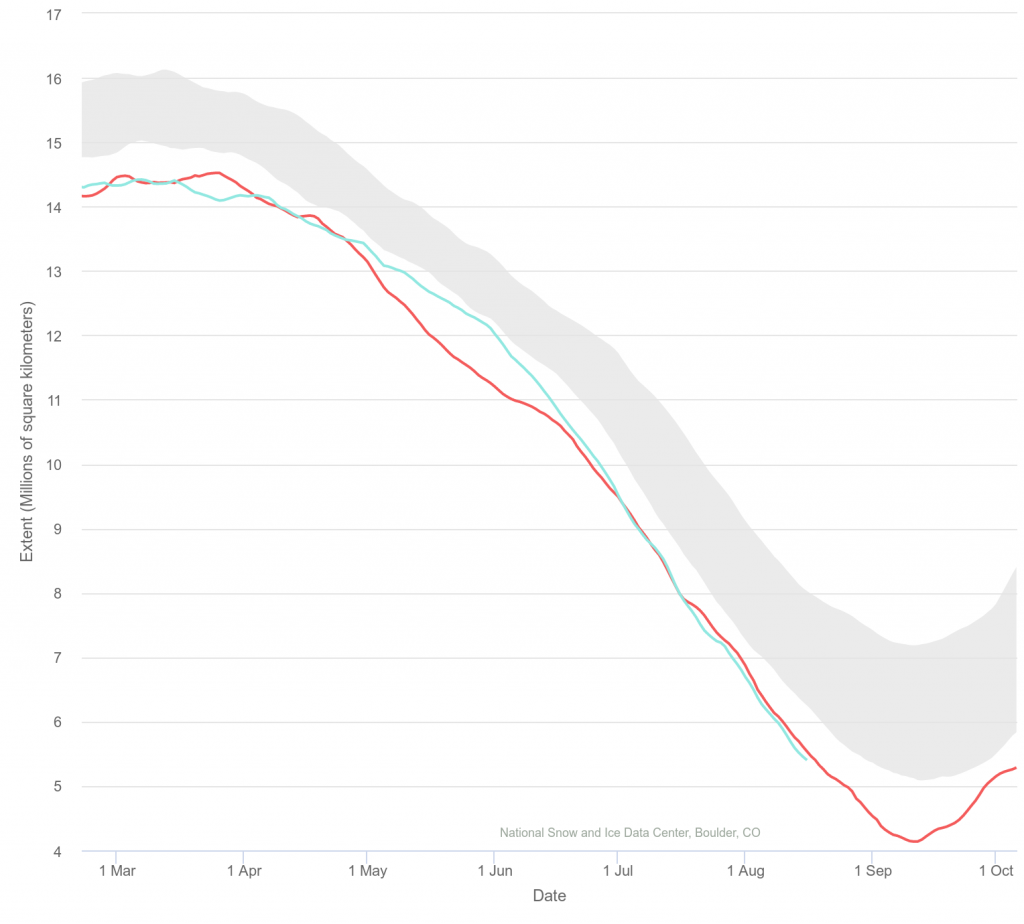
Of course the Sentinel-2 record is too short to say anything about the long term evolution of the glacier. However we can spot some differences between both years. In August 2017 the glacier front is still more advanced than it was last year in July. Also, in 2016 the sea ice started to unlock the glacier tongue earlier than it did in 2017. This is consistent with the fact that in May-June 2016, Arctic sea ice reached a record low. It can be seen using the interactive sea ice graph that the Arctic sea ice extent in 2017 was not as low as it was in 2016:

I wonder if the rapid ablation of the Vavilov glacier front in 2016 is related to the early ice free conditions!
edit on Sep 2018: Sentinel-1 animation
New animation of Vavilov ice cap collapse, this time using #Sentinel1 @CopernicusEU radar (no issue with clouds or polar night)
"You can literally watch an ice cap gut itself in front of your eyes"
quote by @IceSheetMike, 2018
@inrushmd pic.twitter.com/KmG4tkPvsB— Simon Gascoin (@sgascoin) September 24, 2018
