Two years ago I posted an animation of the snow cover area evolution near Zermatt, Switzerland from Sentinel-2 L2A data processed by LIS.
From this time series of snow maps I generated a snow cover duration map and then I added the glacier outlines from the Randolph Glacier Inventory 5.0.

I was satisfied by the overall good agreement between the areas with a high snow cover duration and the glacier outlines. However by looking more closely at the small isolated glacier in the eastern part I noticed a mismatch between both datasets..

Which dataset is wrong? To check the location of the glacier, I uploaded the RGI polygon to the Swiss geoportal.

According to Swiss Topo the standard deviation of the orthophotos geolocation accuracy in complex terrain is +/- 3-5 m, which is lower than the observed offset between the glacier polygon and the glacier photo. Hence, the RGI polygon is not well geolocated, whereas the areas with a snow duration above 300 days from the Sentinel-2 data seems to align well with the orthophoto.
But then, can we use Sentinel-2 snow cover duration maps to automatically detect inaccuracies in the RGI polygons?
This question was investigated by Florent Veillon, a student of the master of geography at Strasbourg University under the supervision of Pierre-Alexis Herrault. In only 2 months, Florent did a very nice work [1]. His report is available here, including all the source code to reproduce his results in R. To sum up the method, he (i) rasterized the glacier polygons from the RGI 6.0 (a more recent version than the one I used) to the same resolution as the Sentinel-2 product, (ii) binarized the Sentinel-2 annual snow duration map with a 300 days threshold to make a map of the permanent snow areas, and (iii) compared both binary images on a pixel basis.
In general, Florent confirmed that there is a very good agreement between both datasets. Yet, the Sentinel-2 data led him to identify a systematic shift in the NW-SE direction in some of the glacier polygons. These errors are shown in black in the picture below [2].

This error is about 2 to 3 pixels of 20 m as shown in this figure:

To conclude it seems that the Sentinel-2 snow cover duration maps can be used to evaluate the RGI. However the method only works for the glacier accumulation areas where the surface is permanently covered by snow. Previous studies [3] have shown that Sentinel-2 observations are effective to map full glacier extents based on a single acquisition (typically an end-of-summer image). A multi-temporal strategy was developed by [4] with Landsat to deal with « the increasing amount of images which makes it difficult to manually select the best glacier mapping scene. ». The global reprocessing of the Sentinel-2 data by ESA to enhance multi-temporal registration should even further increase the value of Sentinel-2 for accurate glacier mapping.
Notes
[1] Veillon F., Evaluation de la qualité de l’inventaire des glaciers à partir du produit de durée annuelle d’enneigement (Sentinel 2) [link]
[2] The orange pixels (« RI: false positive ») are not actual errors, but only reflect the fact that the glacier surface in summer at low elevation is often a mixture of ice and debris therefore is not classified as « snow » by the LIS processor. The glacier firn however should be classified as snow but I did not look carefully into this. The snow detection on glacier is specifically addressed within Theia by Antoine Rabatel.
[3] Paul, F.; Winsvold, S.H.; Kääb, A.; Nagler, T.; Schwaizer, G. Glacier Remote Sensing Using Sentinel-2. Part II: Mapping Glacier Extents and Surface Facies, and Comparison to Landsat 8. Remote Sens. 2016, 8, 575. doi:10.3390/rs8070575
[4] Winsvold, S. H., A. Kääb and C. Nuth, « Regional Glacier Mapping Using Optical Satellite Data Time Series, » in IEEE Journal of Selected Topics in Applied Earth Observations and Remote Sensing, vol. 9, no. 8, pp. 3698-3711, Aug. 2016. doi:10.1109/JSTARS.2016.2527063

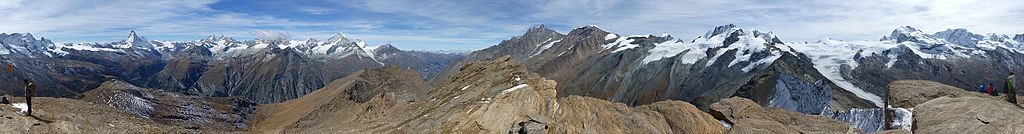
360°-Panorama from Oberrothorn. Source Whgler CC BY-SA 3.0, Link