![]() =>
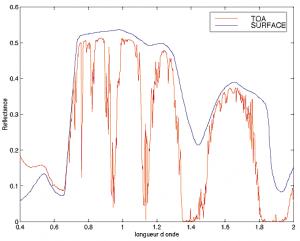
=> ![]() Sentinel-2B has two channels centered on water vapour absorption bands: channel 9 (940 nm) and channel 10 (1380 nm). Band 10 corresponds to a very strong absorption, strong enough to prevent any photon to reach ground from the Sun without being absorbed in the atmosphere. This band is intensively used to detect and correct high clouds. In this blog, we discussed much less band 9 (940 nm) yet. Here, water vapour absorption is not strong enough to catch all the photons which reach the surface. The proportion of absorbed photons depends on the water vapour atmospheric content, and also on the viewing and solar zenith angles. We use band 9 for atmospheric correction, but it could be useful to study convection phenomena within the atmosphere too.Apart from bands 9 and 10, a couple other bands are sensitive to water vapour absorption, in the red and near infrared parts of the spectrum. Bet absorption is low, below 3% generally. It requires a correction but does not need a high accuracy in the water vapour estimation. We do not attempt to correct bands 9 and 10 from absorption, as a much greater accuracy would be needed regarding water vapour. To correct for this absorption, we need to know the water vapour content. To estimate it, we use as reference another band (8a, 865 nm), which is close to band 9 but outside the absorption band. The comparison of TOA reflectances in both bands gives an absorption rate which can be converted in a water vapour content. As absorption is low, we set up a very simple estiomation method, which makes three main assumptions :
Sentinel-2B has two channels centered on water vapour absorption bands: channel 9 (940 nm) and channel 10 (1380 nm). Band 10 corresponds to a very strong absorption, strong enough to prevent any photon to reach ground from the Sun without being absorbed in the atmosphere. This band is intensively used to detect and correct high clouds. In this blog, we discussed much less band 9 (940 nm) yet. Here, water vapour absorption is not strong enough to catch all the photons which reach the surface. The proportion of absorbed photons depends on the water vapour atmospheric content, and also on the viewing and solar zenith angles. We use band 9 for atmospheric correction, but it could be useful to study convection phenomena within the atmosphere too.Apart from bands 9 and 10, a couple other bands are sensitive to water vapour absorption, in the red and near infrared parts of the spectrum. Bet absorption is low, below 3% generally. It requires a correction but does not need a high accuracy in the water vapour estimation. We do not attempt to correct bands 9 and 10 from absorption, as a much greater accuracy would be needed regarding water vapour. To correct for this absorption, we need to know the water vapour content. To estimate it, we use as reference another band (8a, 865 nm), which is close to band 9 but outside the absorption band. The comparison of TOA reflectances in both bands gives an absorption rate which can be converted in a water vapour content. As absorption is low, we set up a very simple estiomation method, which makes three main assumptions :
- the surface reflectance for bands 865 and 940 nm is the same (which is quite accurate, even if small variations are possible)
- all water vapour is above the other layers of the atmosphere (which is really false, but in the near infra-red, the atmosphere does not scatter much except for large aerosol contents). If the surface reflectance is high, this inaccuracy has little importance, and, we are lucky, most earth surfaces except water have rather high surface reflectances in the near infra-red
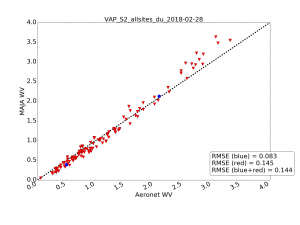
- we computed our look-up tables using 6SV, which samples the spectrum with a resolution of 2.5 nm. Water vapour absorption is in fact the result of a number of very thin absorption lines much thinner than 6S resolution. Our computation is somewhat inaccurate when water vapour content in the atmosphere is high.
- as clouds hide most of the water vapour, we do not compute water vapour above clouds, and use a gap filling method to obtain a water vapour value for each pixel.
You will find more details in MAJA’s Algorithm Theoretical Basis Document. 
First case study : Pô valley, Italy
As you may see on the little map, the studied tile is just west of Milan, and North East of Turin. In the North West corner, the Alps already reach 4000 m with the Monte Rosso. On the water vapour image (you may click to enlarge it), the terrain is visible, due to the fact that water vapour concentrates in the lower layers of the atmosphere. On the zoomed image, a large contrast is visible along a North-South crest where some cumulus clouds are forming. The valley to the West looks dry, while the plain to the East is wet. My interpretation, is that advection started in the east and terrain winds have started to bring wetness from the plains. Regarding the plain, one can note that moisture is greater in the green region in the center of the image rather in the east, near Milan, where vegetation looks dry.
 |
 |
 |
 |
| Sentinel-2 RGB image between Turin and Milan Italy(and zoom on Aosta Valley) | Corresponding water vapour image,between 0 (dark blue) and 2.5 (white) g/cm2. |
Second case study : Mongu Zambia
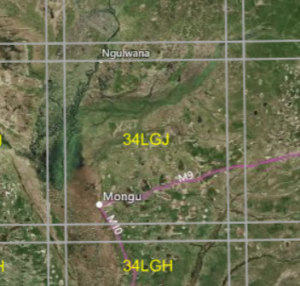
The second case study corresponds to a plateau in Zambia, near Mongu (which is a very famous sites for people working on land product validation). A valley crosses the image in the west. Then a steep slope to reach the plateau from the valley (of course). Moisture is higher in the valley, a little lower in the plateau. Some artefacts may be seen near the small lakes due to the lower surface reflectances. But what drew my attentions are the oscillations are the oscillations of water content forming lines in diagonal. Can you spot them ? I am a complete Boeotian in aeronomy, but could that be gravity waves due to the altitude variation (I hope real aeronomists will not make fun of me !). If I am wrong, explanations are welcome in the comments section 😉
 |
 |
| Sentinel-2 RGB image above Mongu, Zambia | Corresponding water vapour image, between 1.5 and 2.5 g/cm2. |
Finally, I really think Sentinel-2 has potential to interest specialists of atmospheric physics and meteorologists thanks to its ability to image water vapour at a high resolution (~100m). Please tell the experts you know in that domain !
