Marie Ballère started in October 2018 a Ph.D. funded by WWF and CNES. The aim of her Ph.D. is to characterize animal habitats in tropical forest using radar and optical data. The first results on near real time forest disturbances assessment using radar Sentinel-1 data in French Guiana were shown at the ESA Living Planet Symposium 2019 in Milano, and they are striking !
The near real time forest disturbances detection method used by Marie has been described in Bouvet et al. (2018) and successfully tested over a test site in Peru. Classical methods are based on the hypothesis that the radar backscatter decreases when disturbances occur. However, the backscatter does not necessarily decrease, because rainfalls and/or trees remaining on the ground for example, lead to an increase of radar backscatter.
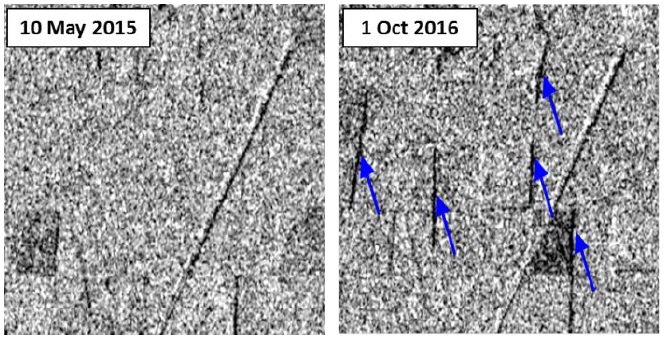
To get around this problem, the method from Bouvet et al. (2018) is based on the detection of radar shadowing. Shadowing occurs in radar images because of the particular side-looking viewing geometry of radar systems. A shadow in a radar image is an area that cannot be reached by any radar pulse. Shadows created by trees at the borders between forest and non-forest areas can be observed in high-resolution radar images (Figure 1), depending on the viewing direction. Shadows that appear are characterized by a sudden drop of backscatter in the radar time series. Thanks to the purely geometrical nature of the shadowing effects, this decrease of backscatter is expected to be persistent over time. New shadows should consequently remain visible for a long time and are easily detectable when dense time series of radar data, such as Sentinel-1 time series, are available.

This method has been tested over various sites in South American, African and Asian tropical forests for three years now and significantly improved. Marie Ballère participated to the improvement of the method, applied it over the whole French Guiana using Sentinel-1 data acquired from 2016 to 2018, and validated the resulting maps. Slashing deforestation (farming method that involves the cutting and burning of trees) detection has been validated using 94 reference data (surface area of 48.2 ha) kindly shared by Pierre Joubert and Eloise Grebic from the Parc Amazonien de Guyane. Producer and user accuracies related to disturbed forests reached 83% and 99% respectively. Gold mining detection has been validated using 36 reference data (surface area of 76 ha), leading to producer and user accuracies of 86% and 99% respectively. In addition, we compared our results with the deforestation patches detected in the University of Maryland (UMD) Global Land Analysis and Discovery (GLAD) Forest Alert dataset (Hansen et al., 2016), a Landsat-based humid tropical forest disturbance alert system over the tropics (http://glad.geog.umd.edu/alerts). Producer accuracies of 24% and 44% were found for slashing deforestation and gold mining respectively. A small area showing the comparison between the CESBIO and UMD-GLAD methods is shown in the maps in Figure 2.

Figure 3 shows the number of disturbed areas detected per month using the CESBIO and UMD-GLAD methods (note that disturbed plots that were not detected using the UMD-GLAD method were not taken into account). Slashing deforestation, occurring mainly during the dry season, was detected timely using both methods. However, because clouds hamper the GLAD optical-based forest disturbances detection during the rainy season, gold mining occurring all year long was detected 72±58 days in advance using the CESBIO method.


The CESBIO method has been applied over the whole French Guiana for the years 2016, 2017 and 2018 (Figure 4). The deforestation rates were found to be -0.7%, -0.5% and -0.5% respectively, relatively to French Guyana area. A lot of exciting research can now be performed based on these results (e.g. for understanding the causes related to the spatial and temporal evolution of disturbances patterns). In addition, Sentinel-1 and Sentinel-2 data are being currently used by Marie to identify the drivers of deforestation.
References:
- Bouvet, A., Mermoz, S., Ballère, M., Koleck, T., & Le Toan, T. (2018). Use of the SAR Shadowing Effect for Deforestation Detection with Sentinel-1 Time Series. Remote Sensing, 10(8), 1250.
- Hansen, M. C., Krylov, A., Tyukavina, A., Potapov, P. V., Turubanova, S., Zutta, B., … & Moore, R. (2016). Humid tropical forest disturbance alerts using Landsat data. Environmental Research Letters, 11(3), 034008.