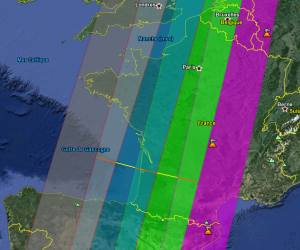
Sentinel-2 orbits

The Sentinel-2 orbit was set so that the swaths observed by the satellite have a little overlap at the equator. The width of the overlap increases quickly at higher latitudes. For instance, at France latitude (45 degrees), about half of the surface will be observed twice per satellite cycle, from two adjacent swaths.It is not very fair, since it will always be the same places that will be observed twice and the rest of the world will only be observed once (The Cesbio site is well located !)

Directional correction for composites.
Well, the issue is that each point within the overlap zone will be observed twice, but under two different viewing angles, and therefore will have different reflectances in each swath, due to the directional effects. The users of our data often ask for monthly syntheses as cloud free as possible, that merge the data observed from different orbits.To obtain such products, a directional correction is therefore necessary.
 |
 |
|---|
Monthly syntheses in Toulouse region, without directional correction on the left, with a directional correction on the right.
N.B.. The scattered green points you may see are invalid points due to saturated pixels (saturations are often observed with SPOT? which will not be the case for Sentinel-2).
To do that, directional models have been developed, such as the ones of Roujean or Ross-Li, that model the directional variations as a function of viewing angles and solar angles, with a rather good accuracy for most types of surfaces. Here is how they look like :
\( \rho= \rho_0 (1 + K_1. F_1(angles), + K_2. F_2 (angles))\)
\( \rho\) is the reflectance for the actual viewing and solar angles \( \rho_0 \) is the reflectance for a given angular condition chosen to standardise the data (for instance viewing at nadir and solar angle at 45 degrees), F1 and F2 are the directional functions that depend on the angles, and \( K_1 and K_2 \) are the coefficients of the directional model, that depend on the observe pixel type of surface.Fortunately, in the case of S2, the angle differences are low, no more than 20 degrees. We have tried, as a first test; to find mean coefficient that could work more or less for all surfaces.
To compute these coefficients, we used the SPOT4 (Take5) sites which have been observed under two viewing directions. These are Maricopa (in the USA), and Midi-Pyrénées, Bretagne and Provence in France. They show very different landscapes, with desert and irrigated crops in Maricopa, a very diverse agricultural landscape in Bretagne and Midi-Pyrénées, and Mediterranean forests and vineyards in Provence. We have used all the available couples of clear images separated by less than 5 days and we searched for the coefficients K_1 and K_2 that allow to minimise differences. Finally, these coefficients were used to correct the data and produce composites. The monthly syntheses are finally obtained by computing a weighted mean value of the reflectance of cloud free pixels obtained during a period of 42 days.
The images above or below show the results obtained by M. Kadiri on the French sites, with on the left the synthesis without directional correction, and on the right the one with directional correction. The shading observed from right to left on the image without correction almost disappears on the images with correction. It is the same for all 3 sites and the chosen images are the ones which show the highest differences. Knowing that the angle difference is greater for SPOT4 (Take5) than for Sentinel-2, we have good hopes that this simple method could work for Sentinel-2.However, our sampling of 4 sites is not sufficient, we will have to prove that theses results still hold for other types of surfaces. We could do that with SPOT5 (Take5) or with the first Sentinel-2 data (which should come soon !).
 |
 |
|---|
Same as above, for Provence-Languedoc.
 |
 |
|---|
Same as above, for Bretagne
