Dave Petley wrote a nice article in the AGU’s Landslide blog about a massive landslide in Glacier Bay, Alaska. This huge avalanche of debris was spotted by a local pilot Paul Swanstrom on June 28. When Paul was above it, « dust was still flying ». Later, based on earthquake records in Alaska, the experts figured out that it probably happened at 8:21 am on the same day.
https://www.facebook.com/MountainFlyingService/photos/a.470593042965002/1286366598054305/?type=3
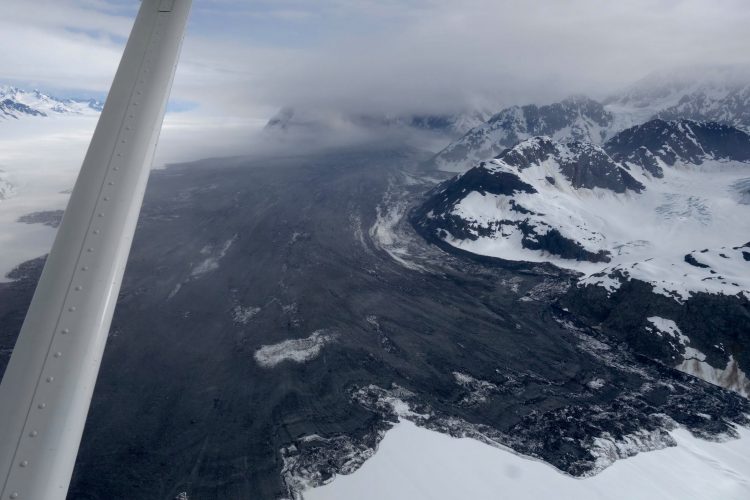
Photo of the the Glacier Bay landslide in Alaska by Paul Swanstrom – MountainFlyingService (click on the image to see the Facebook photo album)
The landslide was estimated to be 10 km long by Paul, but it is not easy to assess the dimensions of a big landslide from plane. Last week @RemotePixel tweeted a beautiful Sentinel-2A image of the landslide.
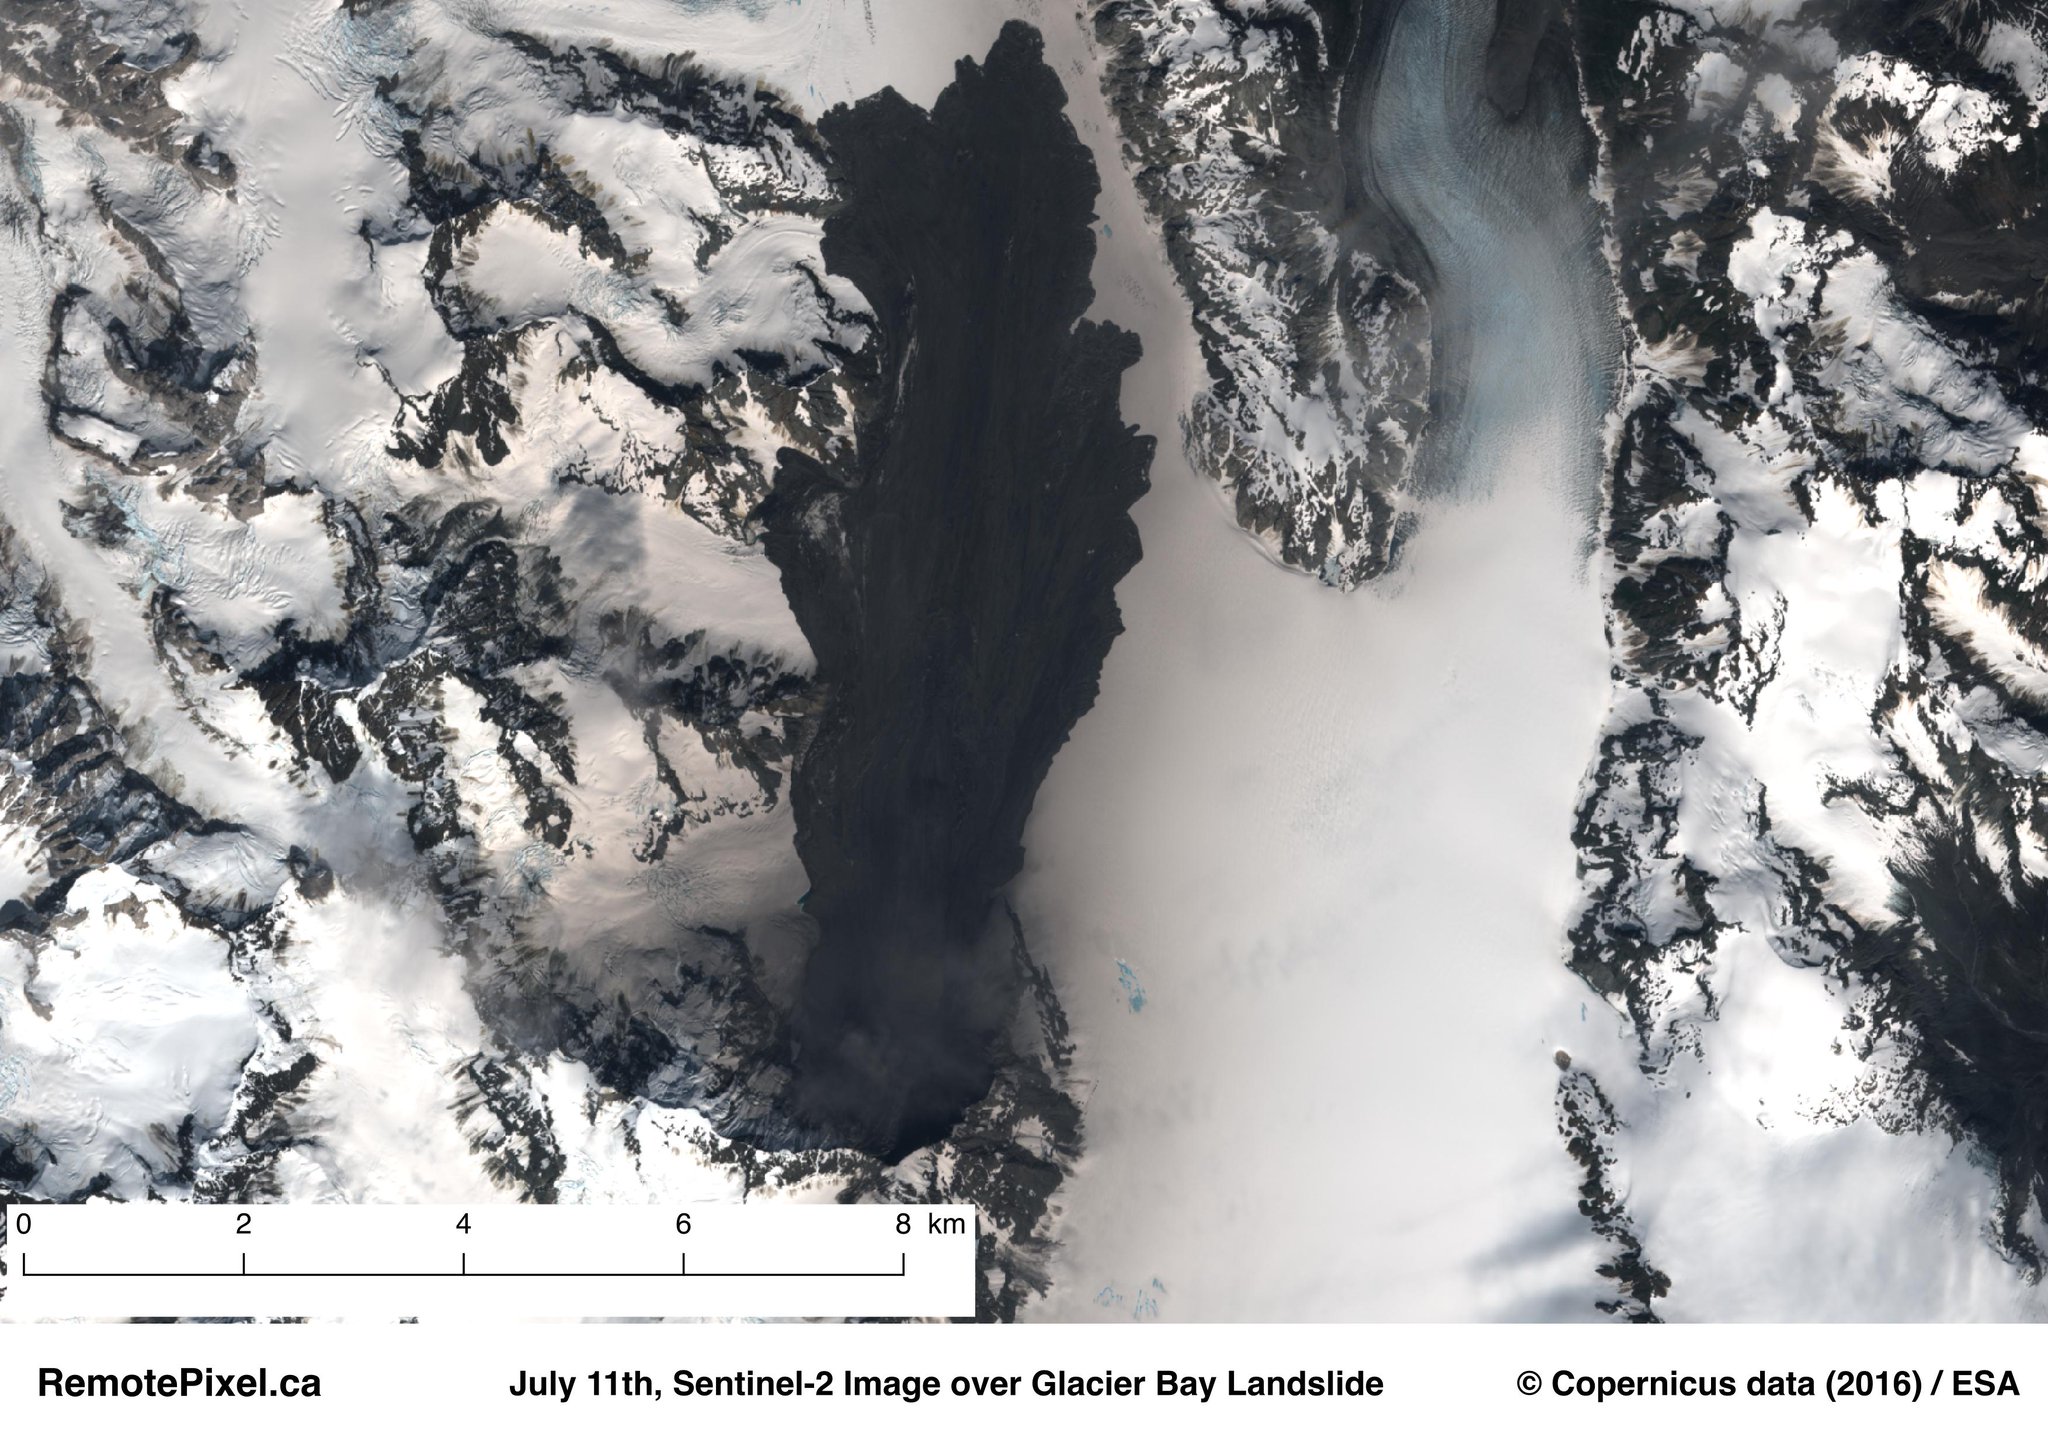
We could probably use this single image to determine the area of this landslide based on an image segmentation algorithm, however a better option is to take advantage of the high revisit capability of Sentinel-2 to apply a detection change method.
Luckily the Sentinel-2A image of 2016-07-11 was already available in the Google Earth Engine.

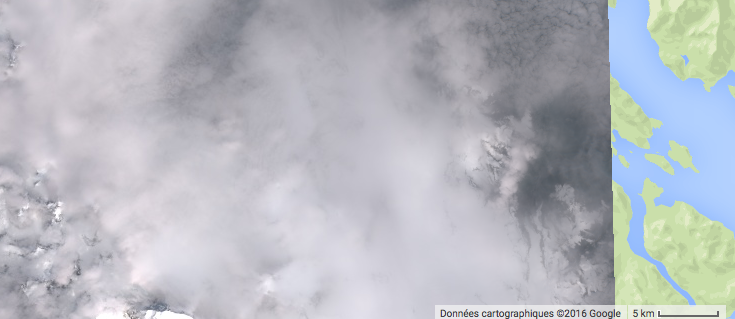
I searched for the most recent image before the landslide. Too bad, it was quite cloudy on June 21st…
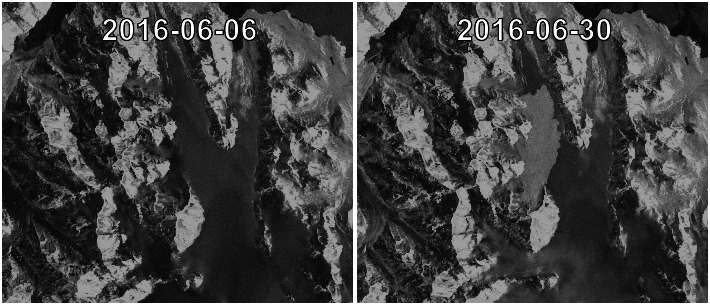
Don’t worry! The observation frequency is high in Alaska because the overlap between the adjacent imaging swaths increases near the poles. Actually there is a clear image taken on June 14.
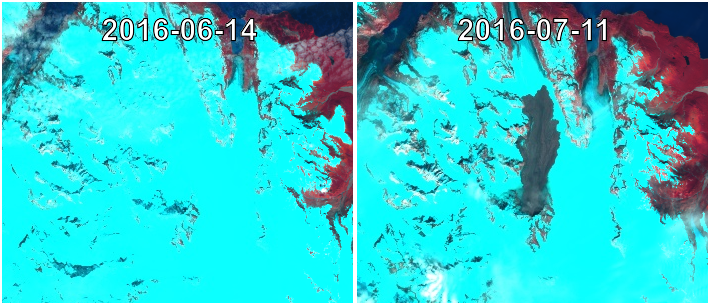
Since the debris layer is darker than the snow in the visible part of the spectra, we can compute the difference between the green bands for example.
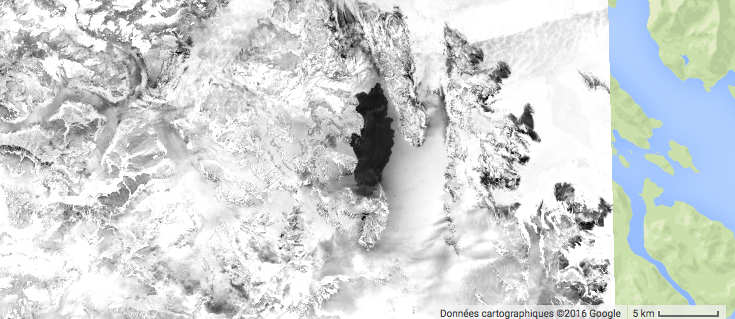
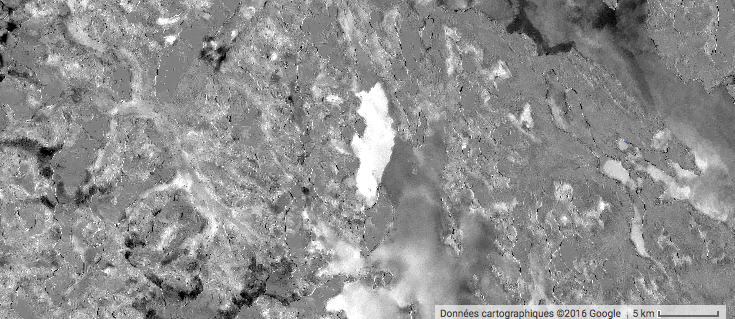
The landslide extent is now even more visible. Yet the time span between both acquisition (28 days) is quite long and some areas in the east appear in dark because the snow had melted over that period… Let’s see if we can reduce this time window with Sentinel-1! Since Sentinel-1 is a radar imaging satellite, we do not need to bother about the clouds and just query the nearest observations after and before the landslide date. However, it is preferable to select similar combination of polarization (VV vs. HH) and orbit (ascending vs. descending). There is an image that was acquired just two days after the presumed landslide date, and another one with similar geometry that was acquired three weeks before.
The landslide is evident due to an increase in the backscatter coefficient. To determine its extent one can also compute the difference between both images. But before that I applied a refined Lee filter to eliminate the remaining speckle noise as kindly suggested M. Lee himself in my previous post.
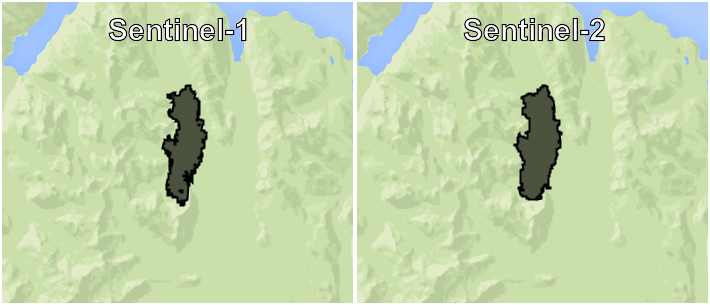
Now we can compare both Sentinel-1 and Sentinel-2 views of the landslides.

Then I simply thresholded the images to mask out the areas with little change:
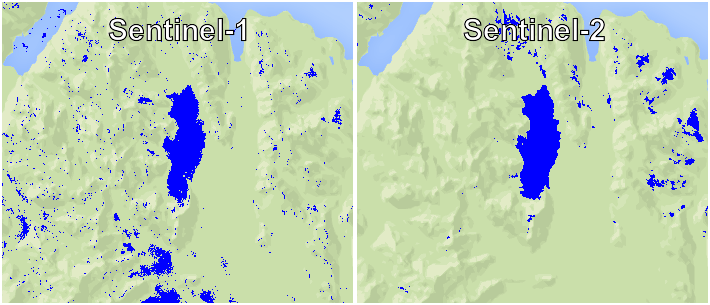
Then I reduced each blue region to a polygon based on an eight-pixel connect. Yesterday night the Earth Engine was a bit capricious and I could only make the vectorization at a scale of 100 m. The area of the landslide polygon is 18.3 km² with Sentinel-1 and 20.4 km² with Sentinel-2. Today I could run the area computation at a finer scale of 20 m and the results were similar (18.6 km² and 20.2 km²).
Before Sentinel-1 and Sentinel-2 researchers often had to develop detection methods based on post-event data only to study rapid land surface processes. The systematic availability of Sentinel products facilitates multi-temporal analyses. If you’re not afraid of the Mrs-Armitage-on-Wheels Syndrom, the script to reproduce this post in GEE is here: http://tully.ups-tlse.fr/simon/glacier-bay-landslide